USD/CAD Price Analysis: Retreats from weekly tops, still well bid around mid-1.2600s


  • USD/CAD gained traction for the second straight day and recovered further from multi-year lows.
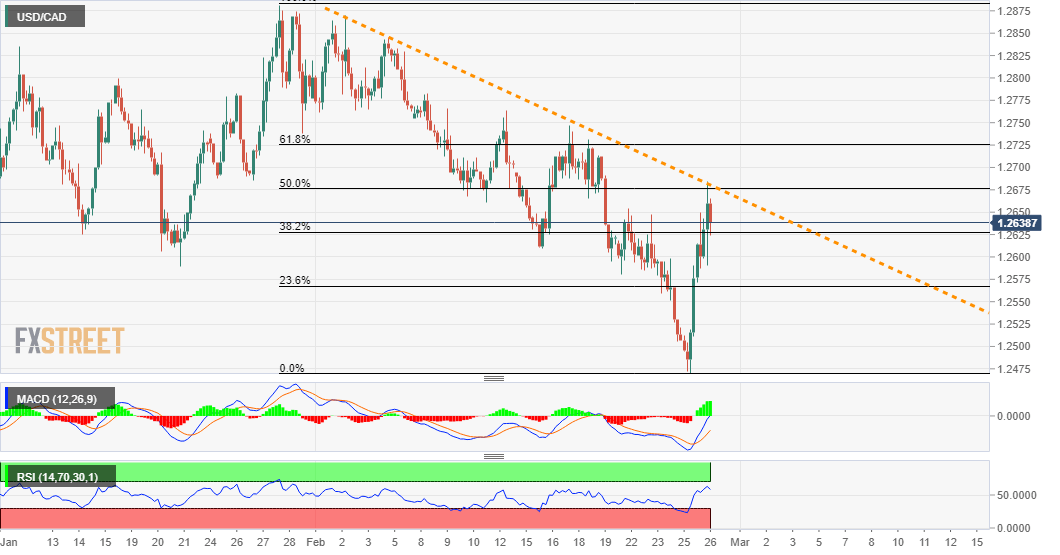
  • The momentum stalled near a descending trend-line/50% Fibo. confluence barrier near 1.2685.
  • Mixed technical indicators on hourly/daily charts warrant caution for aggressive bullish traders.

The USD/CAD pair gained traction for the second consecutive session on Friday and built on the previous day's solid rebound from three-year lows. The momentum pushed the pair to fresh weekly tops, albeit stalled near the 1.2685 confluence hurdle.

The mentioned region marks the 50% Fibonacci level of the 1.2882-1.2468 and monthly descending trend-line. This should now act as a key pivotal point for short-term traders and help determine the USD/CAD pair's next leg of a directional move.

Meanwhile, bullish technical indicators on hourly charts support prospects for additional gains. That said, oscillators on the daily chart – though have been recovering from the bearish territory – are yet to confirm a near-term positive bias.

This makes it prudent to wait for a sustained strength beyond the mentioned confluence barrier before confirming that the USD/CAD pair might have bottomed out in the near-term. This, in turn, will set the stage for a further appreciating move.

The USD/CAD pair might then surpass the 1.2700 mark and aim to test the 61.8% Fibo. level, around the 1.2725-30 region. The momentum could further get extended towards the 1.2775 intermediate resistance en-route the 1.2800 round-figure mark.

On the flip side, the 1.2600 mark now seems to protect the immediate downside. This is followed by support near the 23.6% Fibo. level, around the 1.2570-65 region, which if broken decisively will negate any positive outlook for the USD/CAD pair.

USD/CAD 4-hourly chart

fxsoriginal

Technical levels to watch

USD/CAD

Overview
Today last price 1.2636
Today Daily Change 0.0026
Today Daily Change % 0.21
Today daily open 1.261
 
Trends
Daily SMA20 1.27
Daily SMA50 1.2732
Daily SMA100 1.2885
Daily SMA200 1.3143
 
Levels
Previous Daily High 1.2613
Previous Daily Low 1.2468
Previous Weekly High 1.2746
Previous Weekly Low 1.2594
Previous Monthly High 1.2881
Previous Monthly Low 1.259
Daily Fibonacci 38.2% 1.2558
Daily Fibonacci 61.8% 1.2523
Daily Pivot Point S1 1.2515
Daily Pivot Point S2 1.2419
Daily Pivot Point S3 1.237
Daily Pivot Point R1 1.2659
Daily Pivot Point R2 1.2709
Daily Pivot Point R3 1.2804


Share: Feed news

Information on these pages contains forward-looking statements that involve risks and uncertainties. Markets and instruments profiled on this page are for informational purposes only and should not in any way come across as a recommendation to buy or sell in these assets. You should do your own thorough research before making any investment decisions. FXStreet does not in any way guarantee that this information is free from mistakes, errors, or material misstatements. It also does not guarantee that this information is of a timely nature. Investing in Open Markets involves a great deal of risk, including the loss of all or a portion of your investment, as well as emotional distress. All risks, losses and costs associated with investing, including total loss of principal, are your responsibility. The views and opinions expressed in this article are those of the authors and do not necessarily reflect the official policy or position of FXStreet nor its advertisers. The author will not be held responsible for information that is found at the end of links posted on this page.

If not otherwise explicitly mentioned in the body of the article, at the time of writing, the author has no position in any stock mentioned in this article and no business relationship with any company mentioned. The author has not received compensation for writing this article, other than from FXStreet.

FXStreet and the author do not provide personalized recommendations. The author makes no representations as to the accuracy, completeness, or suitability of this information. FXStreet and the author will not be liable for any errors, omissions or any losses, injuries or damages arising from this information and its display or use. Errors and omissions excepted.

The author and FXStreet are not registered investment advisors and nothing in this article is intended to be investment advice.

Recommended content


Recommended content

Editors’ Picks

AUD/USD holds hot Australian CPI-led gains above 0.6500

AUD/USD holds hot Australian CPI-led gains above 0.6500

AUD/USD consolidates hot Australian CPI data-led strong gains above 0.6500 in early Europe on Wednesday. The Australian CPI rose 1% in QoQ in Q1 against the 0.8% forecast, providing extra legs to the Australian Dollar upside. 

AUD/USD News

USD/JPY sticks to 34-year high near 154.90 as intervention risks loom

USD/JPY sticks to 34-year high near 154.90 as intervention risks loom

USD/JPY is sitting at a multi-decade high of 154.88 reached on Tuesday. Traders refrain from placing fresh bets on the pair as Japan's FX intervention risks loom. Broad US Dollar weakness also caps the upside in the major. US Durable Goods data are next on tap. 

USD/JPY News

Gold price struggles to lure buyers amid positive risk tone, reduced Fed rate cut bets

Gold price struggles to lure buyers amid positive risk tone, reduced Fed rate cut bets

Gold price lacks follow-through buying and is influenced by a combination of diverging forces. Easing geopolitical tensions continue to undermine demand for the safe-haven precious metal. Tuesday’s dismal US PMIs weigh on the USD and lend support ahead of the key US macro data.

Gold News

Crypto community reacts as BRICS considers launching stablecoin for international trade settlement

Crypto community reacts as BRICS considers launching stablecoin for international trade settlement

BRICS is intensifying efforts to reduce its reliance on the US dollar after plans for its stablecoin effort surfaced online on Tuesday. Most people expect the stablecoin to be backed by gold, considering BRICS nations have been accumulating large holdings of the commodity.

Read more

US versus the Eurozone: Inflation divergence causes monetary desynchronization

US versus the Eurozone: Inflation divergence causes monetary desynchronization

Historically there is a very close correlation between changes in US Treasury yields and German Bund yields. This is relevant at the current juncture, considering that the recent hawkish twist in the tone of the Fed might continue to push US long-term interest rates higher and put upward pressure on bond yields in the Eurozone.

Read more

Forex MAJORS

Cryptocurrencies

Signatures