|

USD/CAD Price Analysis: Remains subdued below 1.3500

  • USD/CAD trades sideways below 1.3500, following the footprints of the US Dollar.
  • Fed Waller said the central bank should not rush for rate cuts.
  • The Canadian Retail Sales for December were more robust than expected.

The USD/CAD pair corrects to near 1.3480 in Friday’s European session after failing to sustain above the psychological resistance of 1.3500. The Loonie asset’s action is driven by the subdued US Dollar. After a strong recovery, the US Dollar Index (DXY) turns sideways as investors want fresh guidance on the Federal Reserve’s (Fed) interest rates.

S&P500 futures remain stagnant in the European session, indicating a quiet market mood. The USD Index hovers near 104.00 despite Fed policymakers reiterating the need for more evidence to gain confidence over inflation declining sustainably to the 2% target.

On Thursday, Fed Governor Christopher Waller said the risk in waiting for good inflation data is less than acting on rate cuts too quick. Waller is interested in observing data for at least a couple of months to confirm whether January’s sticky inflation numbers were a one-time blip or progress in price pressures is stalling.

Meanwhile, the Canadian Dollar fails to capitalize on robust Retail Sales data for December. Monthly Retail Sales grew at a robust pace of 0.9% against expectations of 0.8% and a stagnant performance in November. However, it has increased stubbornness in the inflation outlook.

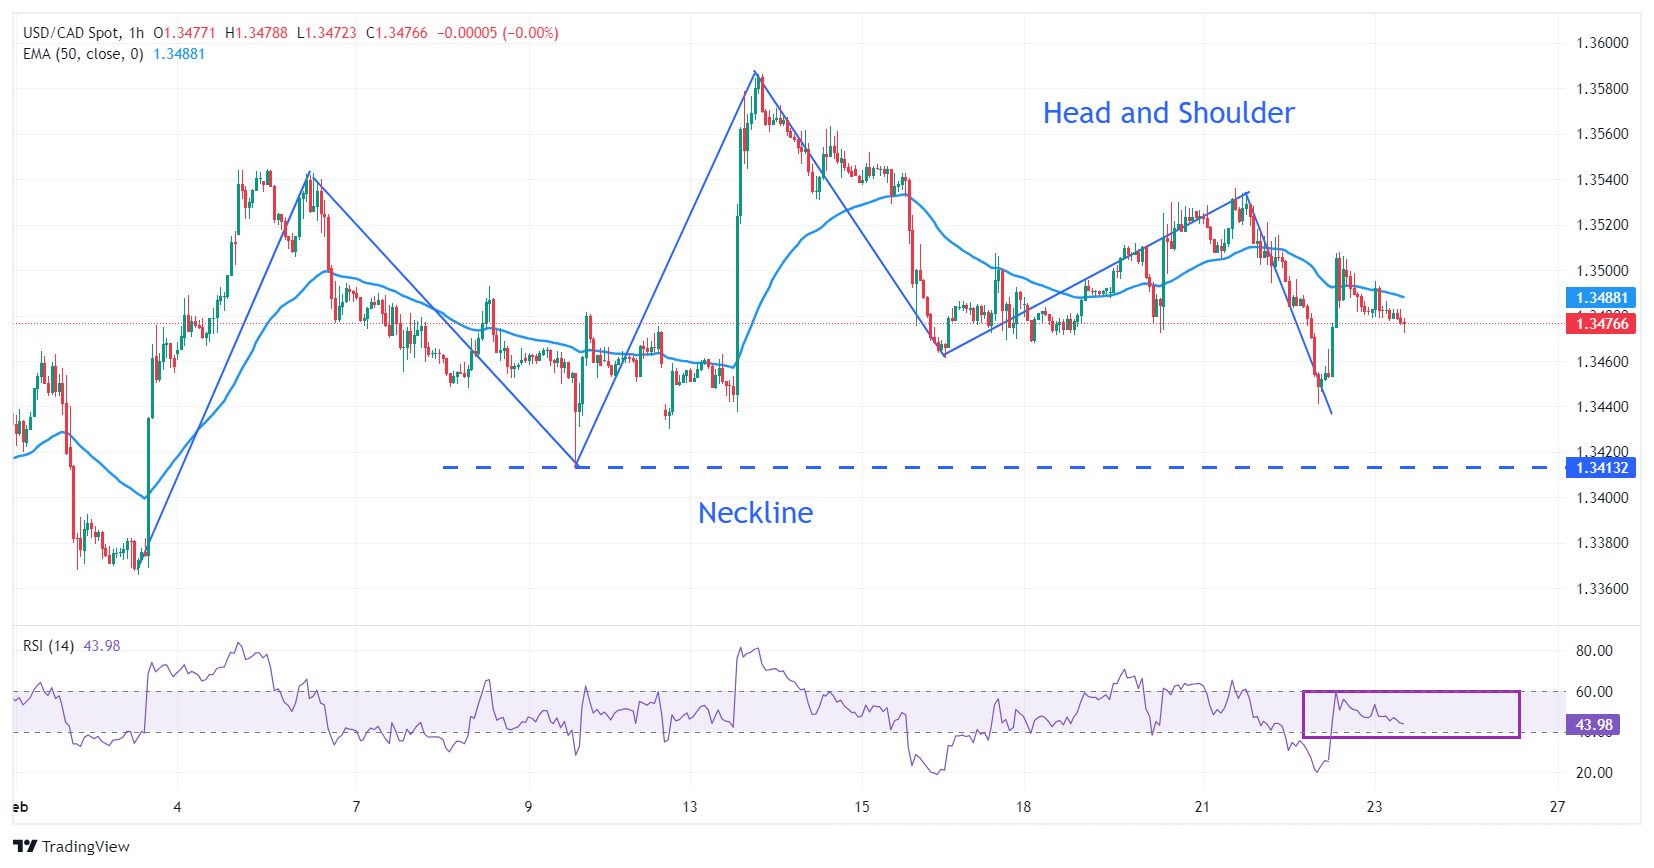
USD/CAD forms a Head and Shoulder chart pattern on an hourly timeframe, which indicates a prolonged consolidation. A breakdown of the neckline plotted from February 9 at 1.3413 will result in a bearish reversal.

The 50-period Exponential Moving Average (EMA) is a significant barricade for the US Dollar bulls. The 14-period Relative Strength Index (RSI) hovers inside 40.00-60.00, which indicates a sideways trend.

A sell-off could appear if the Loonie asset drops below January 31 low at 1.3359. This will expose the asset to January 4 low at 1.3318 and January 5 low at 1.3288.

On the contrary, fresh upside would emerge if the Loonie asset climbs above January 17 high at 1.3542, which will drive asset towards the round-level resistance of 1.3600, followed by November 30 high at 1.3627.

USD/CAD hourly chart
USD/CAD

Overview
Today last price1.3477
Today Daily Change-0.0007
Today Daily Change %-0.05
Today daily open1.3484
 
Trends
Daily SMA201.3474
Daily SMA501.3411
Daily SMA1001.3544
Daily SMA2001.3478
 
Levels
Previous Daily High1.3515
Previous Daily Low1.3441
Previous Weekly High1.3586
Previous Weekly Low1.343
Previous Monthly High1.3542
Previous Monthly Low1.3229
Daily Fibonacci 38.2%1.3469
Daily Fibonacci 61.8%1.3487
Daily Pivot Point S11.3445
Daily Pivot Point S21.3406
Daily Pivot Point S31.337
Daily Pivot Point R11.3519
Daily Pivot Point R21.3554
Daily Pivot Point R31.3594

Author

Sagar Dua

Sagar Dua

FXStreet

Sagar Dua is associated with the financial markets from his college days. Along with pursuing post-graduation in Commerce in 2014, he started his markets training with chart analysis.


More from Sagar Dua
Share:

Editor's Picks

AUD/USD challenges four-week highs beyond 0.7000

AUD/USD continues its march north, this time leaving behind the key 0.7000 hurdle and trading at shouting distance from multi-week tops. The persistent recovery in spot comes amid further losses in the Greenback amid extra improvement in the risk complex.

USD/JPY remains confined in a familiar range below 158.50

USD/JPY sees some dip-buying in the Asian session on Wednesday, though it remains confined within a multi-week range near 158.50 as the uncertainty over the timing of the next BoJ rate hike keeps Japanese Yen bulls on the defensive. Meanwhile, hawkish Fed expectations, bolstered by inflation risks stemming from volatile oil prices, underpin the US Dollar. However, looming intervention fears could limit JPY losses and cap the currency pair.

Gold advances modestly; targets $4,150

Gold prices manage to reverse three consecutive daily declines, trading just below the $4,150 mark per troy ounce on Wednesday. The precious metal’s recovery comes amid a slight drop in the US Dollar, mixed US Treasury yields across the board and a widespread cautious tone from the US-Iran front.

XRP and XLM regain momentum as derivatives activity picks up

Ripple and Stellar are regaining momentum on Wednesday, mirroring gains across major digital assets. XRP has climbed above $1.36, while XLM has reached $0.1854, reinforcing support levels recently tested. This gradual price increase comes amid sticky inflation in the United States and ahead of the Federal Reserve’s monetary decision next week.

What the midterm elections mean for Treasury yields, the Dollar and Gold
Democrats are priced to take the House, so November 3 comes down to the Senate and how much Washington can borrow without the other party. Treasury yields will show the answer first, then the Dollar and Gold. On November 3, Americans vote for all 435 House seats and 35 Senate seats. For bond prices, the result comes down to one thing: how much the government will borrow over the next two years.
The US Dollar fell. Gold didn't rally. That tells you everything
Gold (XAU/USD) is struggling to capitalize on a weaker US Dollar (USD), after repeatedly failing to establish itself above the $4,200 level. The precious metal remains confined to a relatively narrow trading range despite a combination of developments that would normally support higher prices.