USD/CAD Price Analysis: Remains poised to test 100-DMA, focus on US/Canadian data


  • USD/CAD drops further to hit three-week lows below 1.2450.
  • Bears target 100-DMA at 1.2368 amid renewed downside pressure.
  • RSI remains below the midline, allowing room for more declines.
  • Key US, Canadian data in focus for fresh direction on the major.

USD/CAD is extending the recent downtrend into the third straight day on Friday, hitting the lowest levels in three weeks near 1.2430, as the selling pressure remains unabated amid a recovery in WTI prices and easing US dollar.

WTI recaptures ground above $73.50 amid a calmer risk tone while the US dollar resumes its downside, fuelled by the dovish Fed stance and a big miss on the US Q2 GDP figure.

Traders now look forward to the US PCE inflation and Canadian GDP data releases for fresh trading opportunities in the major.

From a near-term technical perspective, USD/CAD remains vulnerable, especially after it faced rejection at the 200-Daily Moving Average (DMA) at 1.2605 earlier this week.

The downside momentum picked up pace after the spot closed Thursday below the 21-DMA at 1.2520, which opened floors for deeper declines.

The bears now target 1.2400, below which the horizontal 100-DMA at 1.2368 could come into play.

The 14-day Relative Strength Index (RSI) trades flat but remains below the midline, suggesting that there is room for more declines.

USD/CAD: Daily chart

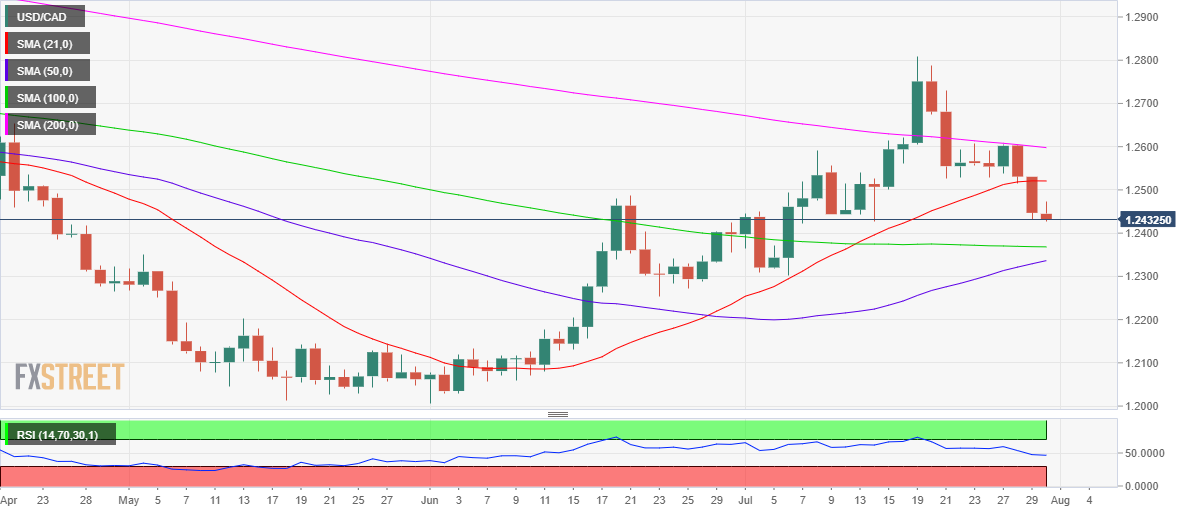
Alternatively, the bulls need to find acceptance above the daily highs of 1.2472 to recapture the 1.2500 round number.

The price will face resistance at the abovementioned 21-DMA. The next relevant resistance will be then seen at the 1.2550 psychological level.

USD/CAD: Additional levels

USD/CAD

Overview
Today last price 1.2431
Today Daily Change -0.0014
Today Daily Change % -0.11
Today daily open 1.2447
 
Trends
Daily SMA20 1.2525
Daily SMA50 1.2329
Daily SMA100 1.2369
Daily SMA200 1.2601
 
Levels
Previous Daily High 1.2532
Previous Daily Low 1.2432
Previous Weekly High 1.2808
Previous Weekly Low 1.2526
Previous Monthly High 1.2487
Previous Monthly Low 1.2007
Daily Fibonacci 38.2% 1.247
Daily Fibonacci 61.8% 1.2494
Daily Pivot Point S1 1.2409
Daily Pivot Point S2 1.2371
Daily Pivot Point S3 1.231
Daily Pivot Point R1 1.2508
Daily Pivot Point R2 1.2569
Daily Pivot Point R3 1.2607


Share: Feed news

Information on these pages contains forward-looking statements that involve risks and uncertainties. Markets and instruments profiled on this page are for informational purposes only and should not in any way come across as a recommendation to buy or sell in these assets. You should do your own thorough research before making any investment decisions. FXStreet does not in any way guarantee that this information is free from mistakes, errors, or material misstatements. It also does not guarantee that this information is of a timely nature. Investing in Open Markets involves a great deal of risk, including the loss of all or a portion of your investment, as well as emotional distress. All risks, losses and costs associated with investing, including total loss of principal, are your responsibility. The views and opinions expressed in this article are those of the authors and do not necessarily reflect the official policy or position of FXStreet nor its advertisers. The author will not be held responsible for information that is found at the end of links posted on this page.

If not otherwise explicitly mentioned in the body of the article, at the time of writing, the author has no position in any stock mentioned in this article and no business relationship with any company mentioned. The author has not received compensation for writing this article, other than from FXStreet.

FXStreet and the author do not provide personalized recommendations. The author makes no representations as to the accuracy, completeness, or suitability of this information. FXStreet and the author will not be liable for any errors, omissions or any losses, injuries or damages arising from this information and its display or use. Errors and omissions excepted.

The author and FXStreet are not registered investment advisors and nothing in this article is intended to be investment advice.

Recommended content


Recommended content

Editors’ Picks

AUD/USD favours extra retracements in the short term

AUD/USD favours extra retracements in the short term

AUD/USD kept the negative stance well in place and briefly broke below the key 0.6400 support to clinch a new low for the year on the back of the strong dollar and mixed results from the Chinese docket.

AUD/USD News

EUR/USD now shifts its attention to 1.0500

EUR/USD now shifts its attention to 1.0500

The ongoing upward momentum of the Greenback prompted EUR/USD to lose more ground, hitting new lows for 2024 around 1.0600, driven by the significant divergence in monetary policy between the Fed and the ECB.

EUR/USD News

Gold aiming to re-conquer the $2,400 level

Gold aiming to re-conquer the $2,400 level

Gold stages a correction on Tuesday and fluctuates in negative territory near $2,370 following Monday's upsurge. The benchmark 10-year US Treasury bond yield continues to push higher above 4.6% and makes it difficult for XAU/USD to gain traction.

Gold News

Bitcoin price defends $60K as whales hold onto their BTC despite market dip

Bitcoin price defends $60K as whales hold onto their BTC despite market dip

Bitcoin (BTC) price still has traders and investors at the edge of their seats as it slides further away from its all-time high (ATH) of $73,777. Some call it a shakeout meant to dispel the weak hands, while others see it as a buying opportunity.

Read more

Friday's Silver selloff may have actually been great news for silver bulls!

Friday's Silver selloff may have actually been great news for silver bulls!

Silver endured a significant selloff last Friday. Was this another step forward in the bull market? This may seem counterintuitive, but GoldMoney founder James Turk thinks it was a positive sign for silver bulls.

Read more

Forex MAJORS

Cryptocurrencies

Signatures