|

USD/CAD Price Analysis: Refreshes two-month high around 1.3400 as Fed delivers hawkish guidance

  • USD/CAD continues a four-day winning streak as investors hope that the Fed would raise interest rates further.
  • A weak Canadian labor market report could allow the BoC to consider a steady interest rate policy ahead.
  • USD/CAD refreshes a two-month high around 1.3400 and prints a fresh swing high.

The USD/CAD pair prints a fresh two-month high near the round-level resistance of 1.3400 in the European session. The Loonie asset extends its four-day winning streak as investors hope that the Federal Reserve (Fed) could continue hiking interest rates further.

Fed Governor Michelle Bowman said over the weekend that the US central bank will raise interest rates further to bring inflation down. This provides strength in the US Dollar Index (DXY) and pushes it above 102.00.

Meanwhile, the Canadian Dollar comes under pressure as the labor market witnessed a drop of 6.4K payrolls in July against expectations of 21.1K fresh additions. The Unemployment Rate jumped to 5.5% as expected from June’s reading of 5.4%. A weak Canadian labor market report could allow the Bank of Canada (BoC) to consider a steady interest rate policy ahead.

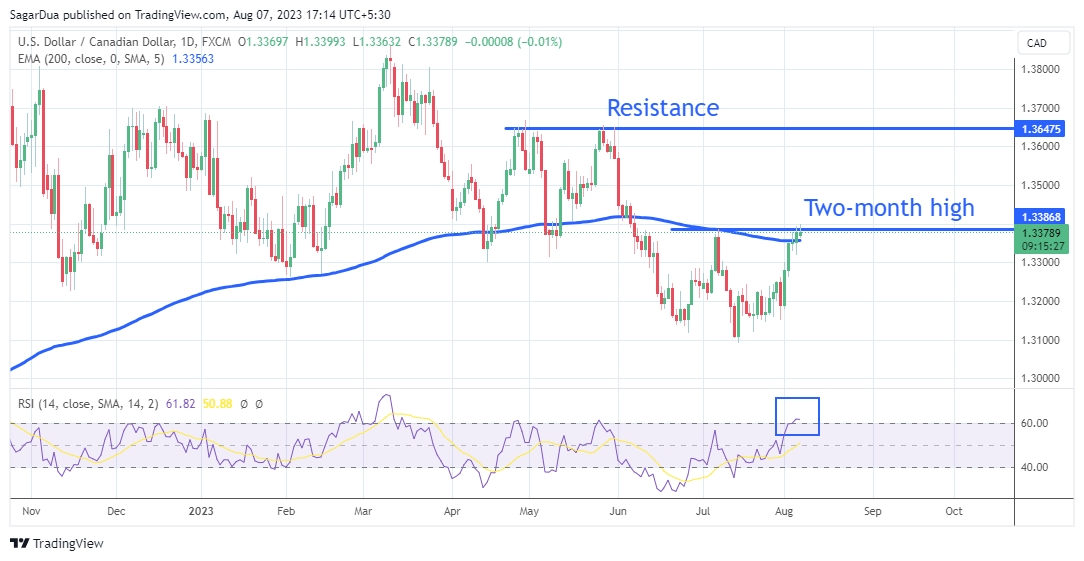
USD/CAD refreshes a two-month high around 1.3400 and prints a fresh swing high on a daily chart. The Loonie climbs above the 200-period Exponential Moving Average (EMA) at 1.3363, which indicates that the long-term trend turns bullish. Horizontal resistance is plotted from April 23 high around 1.3648.

The Relative Strength Index (RSI) (14) jumps into the bullish range of 60.00-80.00. An upside momentum triggers amid an absence of divergence and an oversold situation.

A decisive break above the intraday high at 1.3400 would drive the asset toward June 05 high at 1.3462 followed by the psychological resistance at 1.3500.

In an alternate scenario, a downside move below July 18 high at 1.3288 would drag the asset toward July 27 low around 1.3160 and July 14 low marginally below 1.3100.

USD/CAD daily chart

USD/CAD

Overview
Today last price1.3386
Today Daily Change0.0008
Today Daily Change %0.06
Today daily open1.3378
 
Trends
Daily SMA201.3227
Daily SMA501.3279
Daily SMA1001.3402
Daily SMA2001.3456
 
Levels
Previous Daily High1.3394
Previous Daily Low1.332
Previous Weekly High1.3394
Previous Weekly Low1.3151
Previous Monthly High1.3387
Previous Monthly Low1.3093
Daily Fibonacci 38.2%1.3366
Daily Fibonacci 61.8%1.3348
Daily Pivot Point S11.3334
Daily Pivot Point S21.3289
Daily Pivot Point S31.3259
Daily Pivot Point R11.3408
Daily Pivot Point R21.3439
Daily Pivot Point R31.3483

Author

Sagar Dua

Sagar Dua

FXStreet

Sagar Dua is associated with the financial markets from his college days. Along with pursuing post-graduation in Commerce in 2014, he started his markets training with chart analysis.

More from Sagar Dua
Share:

Editor's Picks

AUD/USD eyes 0.7150 barrier nine-day EMA

AUD/USD inches higher after registering modest losses in the previous day, trading around 0.7130 during the Asian hours. The technical analysis of the daily chart indicates that the pair is moving sideways within the rectangle pattern, suggesting a consolidation as neither the bulls nor the bears have enough momentum to take control of the market.

USD/JPY trades below 160.00 intervention threshold; bullish bias intact

The USD/JPY pair attracts some sellers during the Asian session amid fears that authorities will step in again to prop up the Japanese Yen. Furthermore, the Israel-Lebanon truce prompts some profit-taking around the US Dollar and exerts downward pressure on the currency pair.

Gold defends 200-day SMA at $4,425, but for how long?

Gold is attempting a tepid recovery toward $4,500 early Thursday, as renewed optimism in the Mideast geopolitical front calms market nerves. This cautious optimism across Asian markets weighs on Oil prices, and diminishes the US Dollar’s safe-haven appeal, helping Gold stage a decent comeback from the weekly low of $4,424.


Hyperliquid: ETF demand, capital rotation fuel HYPE rally as Bitcoin melts

Hyperliquid price sustains an upward trend near its all-time high of $75.76 on Thursday after posting 80% gains in May, while Bitcoin (BTC) retraces below $65,000, triggering a market-wide panic.

Kevin Warsh takes the Fed helm: What it means for the US Dollar
The Federal Reserve moves away from the highly predictable "forward guidance" model of the Jerome Powell era to a new “Kevin Warsh environment”, characterized by less communication, more policy surprises, and an increased focus on the Fed's complex balance sheet.
Recession on paper: What really moves the Canadian Loonie now?

Statistics Canada handed the headline writers a gift and the analysts a headache. Real GDP shrank 0.1% on an annualized basis in the first quarter, and with the fourth quarter of 2025 revised down to a 1.0% contraction, that is two negative quarters in a row, the textbook definition of a technical recession and Canada's first since the pandemic.