|

USD/CAD Price Analysis: Range restricts to 40-pips as investors await US/Canada Employment data

  • USD/CAD has locked in a tight range ahead of the US/Canada labor market data.
  • The tight US labor market is cooling down as firms have eased their recruitment process.
  • Canada’s Employment Change is seen at 12K and the Unemployment Rate might escalate to 5.1%.

The USD/CAD pair corrected below 1.3450 in the early Asian session as the US Dollar Index (DXY) showed a loss in the upside momentum after reaching to the critical resistance of 102.00. The Loonie asset is expected to deliver a power-pack action as investors are awaiting the release of the United States/Canada Employment data.

The tight US labor market is cooling down as firms have eased their recruitment process observed after a slowdown in Job Openings and weak additions of fresh jobs through Automatic Data Processing (ADP). This has triggered expectations of steady interest rates by the Federal Reserve (Fed) for its May policy meeting.

Meanwhile, S&P500 futures have resumed their downside journey, conveying a risk-off market mood.

The Canadian Dollar will be impacted by the Employment data. As per the consensus, Net Change in Employment is seen at 12K, lower than the former release of 21.8K. The Unemployment Rate is seen higher at 5.1% vs. the former release of 5.0%.

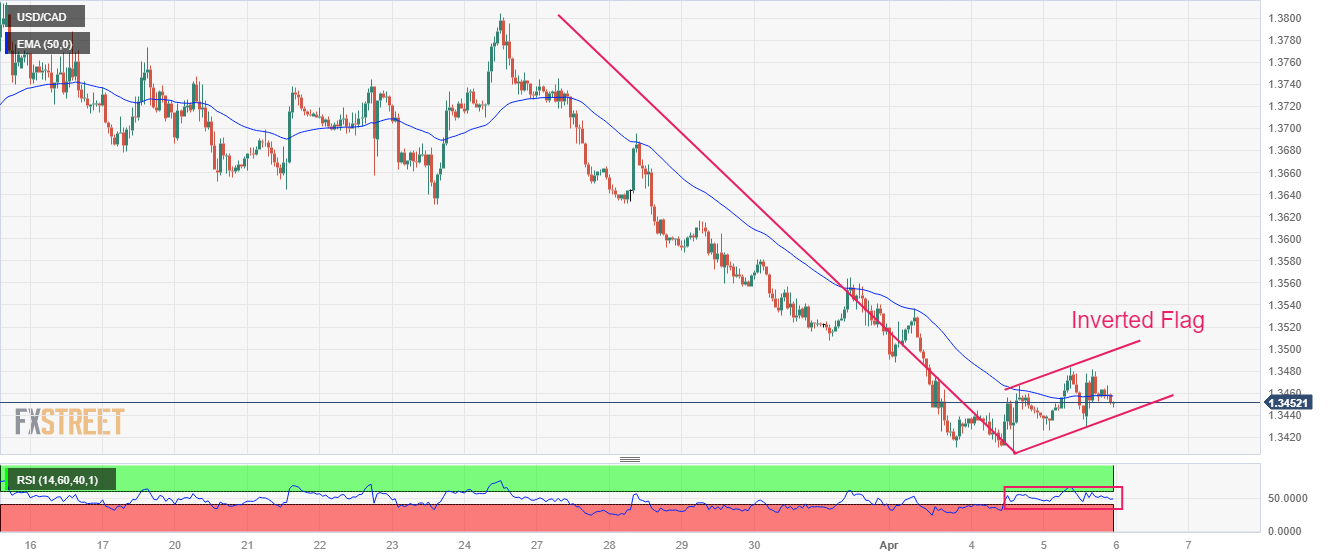
USD/CAD is auctioning in an Inverted Flag chart pattern on an hourly scale. An Inverted Flag is a trend-following pattern that displays a long consolidation that is followed by a breakdown. Usually, the consolidation phase of the chart pattern serves as an inventory adjustment in which those participants initiate shorts, which prefer to enter an auction after the establishment of a bearish bias and current sellers add more positions.

The Loonie asset has failed to sustain above the 50-period Exponential Moving Average (EMA) at 1.3458, which indicates more weakness ahead.

Meanwhile, the upside in the Relative Strength Index (RSI) (14) is capped around 60.00. A slippage into the bearish range of 20.00-40.00 will activate the downside momentum.

A downside break below April 04 low at 1.3406 will expose the asset to a fresh six-week low near 1.3350, which is February 6 low followed by the round-level support at 1.3300.

In an alternate scenario, an upside move above the psychological resistance of 1.3500 will shift traction in the favor of US Dollar bulls, which will drive the asset toward March 31 high and March 29 high at 1.3559 and 1.3619 respectively.

USD/CAD hourly chart
USD/CAD

Overview
Today last price1.3452
Today Daily Change0.0007
Today Daily Change %0.05
Today daily open1.3445
 
Trends
Daily SMA201.367
Daily SMA501.3546
Daily SMA1001.3524
Daily SMA2001.3381
 
Levels
Previous Daily High1.3467
Previous Daily Low1.3406
Previous Weekly High1.3745
Previous Weekly Low1.3508
Previous Monthly High1.3862
Previous Monthly Low1.3508
Daily Fibonacci 38.2%1.3444
Daily Fibonacci 61.8%1.3429
Daily Pivot Point S11.3411
Daily Pivot Point S21.3378
Daily Pivot Point S31.335
Daily Pivot Point R11.3473
Daily Pivot Point R21.3501
Daily Pivot Point R31.3535

Author

Sagar Dua

Sagar Dua

FXStreet

Sagar Dua is associated with the financial markets from his college days. Along with pursuing post-graduation in Commerce in 2014, he started his markets training with chart analysis.


More from Sagar Dua
Share:

Editor's Picks

GBP/USD bounces off four-day lows, still below 1.3500

GBP/USD sticks to the bearish tone on Thursday, coming down to the 1.3480 region in the latter part of the NA session. In the meantime, Cable’s weakness comes as investors continue to assess mixed UK data, poor US results, and the persistent uncertainty surrounding the US-Iran conflict.

EUR/USD looks apathetic around 1.1530

EUR/USD reverses Wednesday’s downtick and trades with modest gains in the 1.1530 region following the end of the NA session on Thursday. The pair’s tepid advance comes on the back of the absence of clear direction in the US Dollar despite tensions from the Middle East appear far from alleviated. Later on Friday, investors are expected to monitor the the releases of another revision of GDP figures in the Euroland, US Retail Sales and the preliminary U-Mich gauge.

Gold loses the grip, recedes toward $4,350

Gold extends its intraday pullback on Thursday, retesting the $4,350 zone per troy ounce, or three-day troughs. Meanwhile, the yellow metal continues to monitor developments from the Middle East as well as bets surrounding the potential Fed’s rate path.

Ethereum Price Forecast: Fidelity plans to add staking to ETH ETF amid yield debate
Asset manager Fidelity has filed with the US Securities and Exchange Commission (SEC) to permit staking in its Ethereum (ETH) exchange-traded fund (ETF), the Fidelity Ethereum Fund (FETH), which holds over $898 million in net assets.
Week ahead – Summer lull could be tested by geopolitics and central bank expectations

US dollar stabilizes as September Fed hike bets remain subdued. Market volatility stays low, but thin liquidity could amplify movements. Key UK data could challenge pound strength; euro craves bullish catalysts.

Why is Crude Oil priced for a reopening the ships haven't made?
Fourteen vessels crossed the Strait of Hormuz on Tuesday. Before the war, the count ran near 120 a day. In the sessions since the waterway was publicly declared open, Brent has drifted back to $87 and West Texas Intermediate (WTI) to $81, both a little lower again on Wednesday, with daily momentum on each unwound from the top of its range in late July to the low twenties now.














