|

USD/CAD Price Analysis: Off multi-month-old support line but upside remains capped below 1.3380

  • USD/CAD portrays corrective bounce from seven-month-old ascending support line.
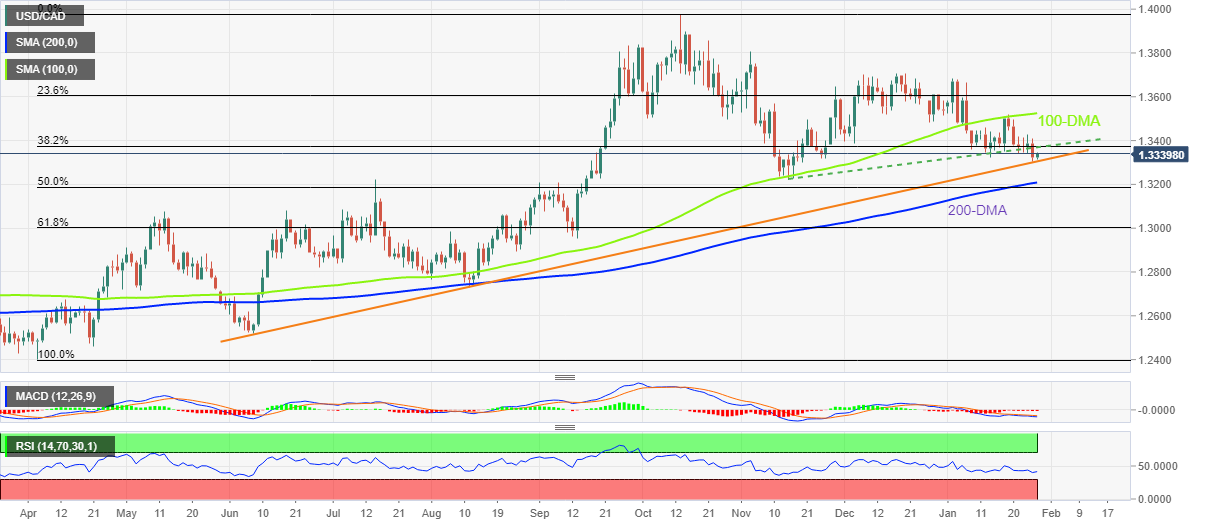
  • Downbeat oscillators, 38.2% Fibonacci retracement and previous support line guards recovery moves.
  • 100-DMA holds the key to buyer’s conviction while break of 1.3300 could aim for 200-DMA.

USD/CAD picks up bids to pare recent losses around the lowest levels in 11 weeks, mildly bid near 1.3340 heading into Friday’s European session. In doing so, the Loonie pair bounces off an upward-sloping support line from early June 2022.

However, a convergence of the previous support line from mid-November and the 38.2% Fibonacci retracement level of the pair’s April-October upside, near 1.3380 by the press time, restricts USD/CAD pair’s recovery.

Other than the aforementioned key resistance confluence near 1.3380, the bearish MACD signals and the downward-sloping RSI (14) also challenge the Loonie pair’s corrective bounce.

Even if the USD/CAD buyers manage to cross the 1.3380 hurdle, the 100-DMA surrounding 1.3525 will be crucial to stop the upside momentum, a break of which won’t hesitate to challenge the monthly high of near 1.3685.

On the flip side, a daily closing below the stated multi-month-old support line, close to 1.3300 at the latest, could quickly fetch the USD/CAD pair towards the 200-DMA support of around 1.3210.

In a case where the USD/CAD remains bearish past 1.3210, the 1.3200 round figure may act as the last defense of buyers before relinquishing control.

USD/CAD: Daily chart

Trend: Limited recovery expected

Additional important levels

Overview
Today last price1.3339
Today Daily Change0.0015
Today Daily Change %0.11%
Today daily open1.3324
 
Trends
Daily SMA201.3445
Daily SMA501.3504
Daily SMA1001.3522
Daily SMA2001.3205
 
Levels
Previous Daily High1.3408
Previous Daily Low1.3303
Previous Weekly High1.3521
Previous Weekly Low1.3351
Previous Monthly High1.3705
Previous Monthly Low1.3385
Daily Fibonacci 38.2%1.3343
Daily Fibonacci 61.8%1.3368
Daily Pivot Point S11.3282
Daily Pivot Point S21.324
Daily Pivot Point S31.3178
Daily Pivot Point R11.3387
Daily Pivot Point R21.345
Daily Pivot Point R31.3492

Author

Anil Panchal

Anil Panchal

FXStreet

Anil Panchal has nearly 15 years of experience in tracking financial markets. With a keen interest in macroeconomics, Anil aptly tracks global news/updates and stays well-informed about the global financial moves and their implications.

More from Anil Panchal
Share:

Markets move fast. We move first.

Orange Juice Newsletter brings you expert driven insights - not headlines. Every day on your inbox.

By subscribing you agree to our Terms and conditions.

Editor's Picks

EUR/USD off three-month highs, holds near 1.1800 on softer US Dollar

EUR/USD consolidates gains below 1.1800 in the European trading hours on Wednesday. A broadly subdued US Dollar continues to underpin the pair amid quiet markets and thin liquidity conditions on Christmas Eve. 

GBP/USD keeps range around 1.3500 amid quiet markets

GBP/USD keeps its range trade intact at around 1.3500 in the European session on Wednesday. The Pound Sterling holds the upper hand over the US Dollar amid pre-Christmas light trading as traders turn to sidelines heading into the holiday season. 

Gold retreats from record highs amid profit-taking on Christmas Eve

Gold retreats following the move higher to the $4,525 area, or a fresh all-time peak, though the downside remains limited amid a bullish fundamental backdrop. The US Dollar selling bias remains unabated on the back of dovish Fed expectations, which continues to act as a tailwind for the bullion amid persistent geopolitical risks.

Shiba Inu's bears tighten grip, aiming for yearly lows

Shiba Inu price remains under pressure, trading below $0.000070 on Wednesday as bearish momentum continues to dominate the broader crypto market. On-chain and derivatives data further support the bearish sentiment, while technical analysis suggests a deeper correction targeting the yearly lows.

Economic outlook 2026-2027 in advanced countries: Solidity test

After a year marked by global economic resilience and ending on a note of optimism, 2026 looks promising and could be a year of solid economic performance. In our baseline scenario, we expect most of the supportive factors at work in 2025 to continue to play a role in 2026.

Stellar Price Forecast: XLM slips below $0.22 as bearish momentum builds

Stellar (XLM) price is trading below $0.22 at the time of writing on Wednesday after failing to close above the key resistance earlier this week. Bearish momentum continues to strengthen, with open interest falling and short bets rising.