|

USD/CAD Price Analysis: Moves below 1.3700 followed by 50-day EMA

  • USD/CAD could face further losses on improved Crude oil prices.
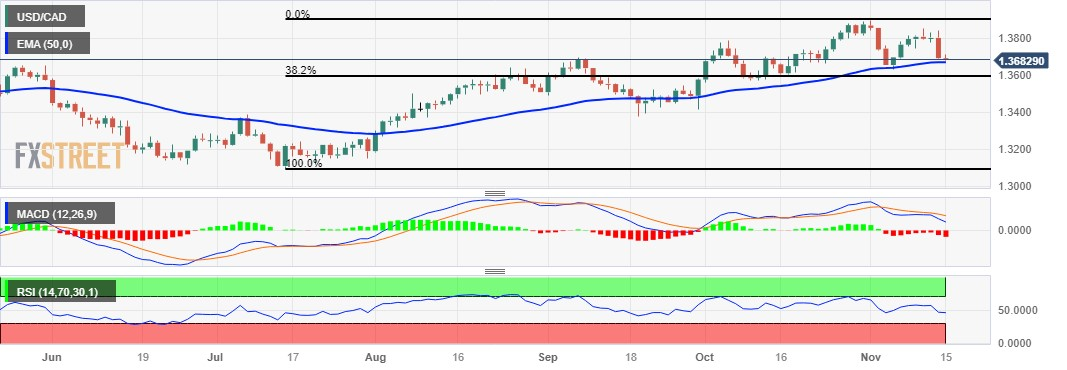
  • Technical indicators suggest a shift toward a weaker market sentiment.
  • The 1.3600 major level emerges as a key support, followed by the 38.2% Fibonacci retracement.

The USD/CAD pair experiences downward pressure following the release of weaker US inflation data on Tuesday. Moreover, the uptick in crude oil prices is likely supporting the Canadian Dollar (CAD), adding to the pressure on the USD/CAD pair.

The technical indicators paint a bearish picture for the USD/CAD pair. The 14-day Relative Strength Index (RSI) below the 50 level indicates downward pressure, signaling a bearish momentum and reflecting a weaker market sentiment.

Additionally, the Moving Average Convergence Divergence (MACD) line, while above the centerline, has shown a divergence below the signal line. This suggests a potential shift in momentum towards a bearish sentiment in the USD/CAD pair.

The USD/CAD pair trades around 1.3690 during the early European session, after falling by almost 100 pips since the previous session. The 50-day Exponential Moving Average (EMA) at 1.3670 could act as the immediate support.

A firm break below the latter could influence the USD/CAD pair to navigate the region around the psychological level at 1.3600, followed by the 38.2% Fibonacci retracement at 1.3591 level.

On the upside, the major level at 1.3700 appears to be a key barrier. If there is a breakthrough above the latter, the bulls could revisit the weekly highs around the 1.3843 level.

USD/CAD: Daily Chart

USD/CAD: other technical levels

Overview
Today last price1.3681
Today Daily Change-0.0011
Today Daily Change %-0.08
Today daily open1.3692
 
Trends
Daily SMA201.377
Daily SMA501.3657
Daily SMA1001.351
Daily SMA2001.3505
 
Levels
Previous Daily High1.3844
Previous Daily Low1.3684
Previous Weekly High1.3855
Previous Weekly Low1.3629
Previous Monthly High1.3892
Previous Monthly Low1.3562
Daily Fibonacci 38.2%1.3745
Daily Fibonacci 61.8%1.3783
Daily Pivot Point S11.3637
Daily Pivot Point S21.3581
Daily Pivot Point S31.3478
Daily Pivot Point R11.3796
Daily Pivot Point R21.3899
Daily Pivot Point R31.3955

Author

Akhtar Faruqui

Akhtar Faruqui is a Forex Analyst based in New Delhi, India. With a keen eye for market trends and a passion for dissecting complex financial dynamics, he is dedicated to delivering accurate and insightful Forex news and analysis.

More from Akhtar Faruqui
Share:

Markets move fast. We move first.

Orange Juice Newsletter brings you expert driven insights - not headlines. Every day on your inbox.

By subscribing you agree to our Terms and conditions.

Editor's Picks

EUR/USD struggles to extend advance above 1.1800

The EUR/USD pair posts a fresh weekly low near 1.1740 during the Asian trading session on Wednesday. The major currency pair is under pressure as the US Dollar edges higher despite Federal Open Market Committee minutes of the December policy meeting, released on Tuesday, showing that most policymakers stressed the need for further interest rate cuts.

GBP/USD trades flat above 1.3450 amid thin trading volume

The GBP/USD pair holds steady around 1.3465 during the early Asian trading hours on Wednesday. However, the Bank of England guided that monetary policy will remain on a gradual downward path, which might underpin the Cable against the US Dollar. Financial markets are expected to trade on thin volumes as traders prepare for the New Year holiday.

Gold attempts another run toward $4,400 on final day of 2025

Gold price makes another attempt toward $4,400 in Asian trading on Tuesday, keeping the recovery mode intact following Monday's over 4% correction. The bright metal seems to cheer upbeat Chinese NBS and RatingDog Manufacturing and Services PMI data for December. 

Top Crypto Gainers: Canton, Four, Plasma rally secures double-digit gains

Canton, Four, and Plasma are the top-performing crypto assets over the last 24 hours with double-digit gains. The extended recovery in Canton is gaining traction while Four and Plasma target a decisive close above the 200-period Exponential Moving Average on the 4-hour chart.

Economic outlook 2026-2027 in advanced countries: Solidity test

After a year marked by global economic resilience and ending on a note of optimism, 2026 looks promising and could be a year of solid economic performance. In our baseline scenario, we expect most of the supportive factors at work in 2025 to continue to play a role in 2026.

Crypto market outlook for 2026

Year 2025 was volatile, as crypto often is.  Among positive catalysts were favourable regulatory changes in the U.S., rise of Digital Asset Treasuries (DAT), adoption of AI and tokenization of Real-World-Assets (RWA).