|

USD/CAD Price Analysis: Defends 1.3650 resistance-turned-support ahead of Canadian jobs data

  • USD/CAD meets with some supply on Friday and is pressured by a modest USD weakness.
  • Hawkish Fed expectations and softer Oil prices limit losses ahead of Canadian jobs report.
  • A convincing break below the 1.3600 mark might shift the bias in favour of bearish traders.

The USD/CAD pair comes under some selling pressure on Friday and reverses a part of the previous day's positive move to the 1.3700 neighbourhood, or its highest level since late March. Spot prices, however, manage to rebound a few pips from the daily low and trade around the 1.3665-1.3670 area during the first half of the European session, down less than 0.15% for the day.

A modest US Dollar (USD) retracement slide from a six-month top, triggered by retreating US Treasury bond yields, turns out to be a key factor exerting some downward pressure on the USD/CAD pair. That said, expectations that the Federal Reserve (Fed) will keep interest rates higher for longer should act as a tailwind for the US bond yields and the USD. Apart from this, a softer tone surrounding Crude Oil prices undermines the commodity-linked Loonie and contributes to limiting the downside for the major. Traders also seem reluctant to place aggressive bets and prefer to wait for the release of the Canadian jobs report, due later during the early North American session.

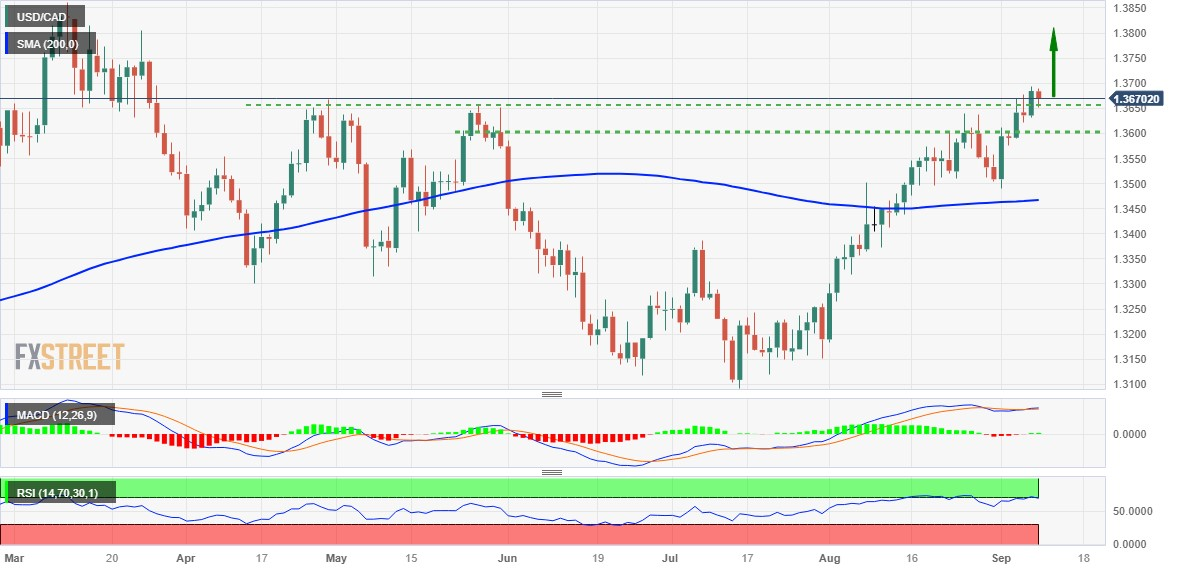
From a technical perspective, the intraday downtick stalls near the 1.3650 horizontal resistance breakpoint, now turned support. Any further decline is more likely to attract fresh buyers and remain limited near the 1.3600 round-figure mark. The latter should act as a key pivotal point, which if broken decisively should pave the way for some meaningful corrective decline. The USD/CAD pair might then accelerate the slide towards the next relevant support near the 1.3525 region en route to the 1.3500 1.3500 psychological mark. Some follow-through selling will expose the very important 200-day Simple Moving Average (SMA), currently currently around the 1.3460 region.

On the flip side, bullish traders might now wait for a sustained strength beyond the 1.3700 mark before placing fresh bets. The subsequent move-up has the potential to lift the USD/CAD pair towards the 1.3730 resistance zone en route to the 1.3800 round figure. The upward trajectory could get extended further and push spot prices towards retesting the YTD top, around the 1.3860 region touched in March.

USD/CAD daily chart

fxsoriginal

Technical levels to watch

USD/CAD

Overview
Today last price1.3668
Today Daily Change-0.0016
Today Daily Change %-0.12
Today daily open1.3684
 
Trends
Daily SMA201.3559
Daily SMA501.338
Daily SMA1001.3404
Daily SMA2001.3466
 
Levels
Previous Daily High1.3694
Previous Daily Low1.3632
Previous Weekly High1.3637
Previous Weekly Low1.3489
Previous Monthly High1.364
Previous Monthly Low1.3184
Daily Fibonacci 38.2%1.3671
Daily Fibonacci 61.8%1.3656
Daily Pivot Point S11.3646
Daily Pivot Point S21.3608
Daily Pivot Point S31.3584
Daily Pivot Point R11.3709
Daily Pivot Point R21.3733
Daily Pivot Point R31.3771

Author

Haresh Menghani

Haresh Menghani is a detail-oriented professional with 10+ years of extensive experience in analysing the global financial markets.

More from Haresh Menghani
Share:

Editor's Picks

AUD/USD eyes 0.7150 barrier nine-day EMA

AUD/USD inches higher after registering modest losses in the previous day, trading around 0.7130 during the Asian hours. The technical analysis of the daily chart indicates that the pair is moving sideways within the rectangle pattern, suggesting a consolidation as neither the bulls nor the bears have enough momentum to take control of the market.

USD/JPY trades below 160.00 intervention threshold; bullish bias intact

The USD/JPY pair attracts some sellers during the Asian session amid fears that authorities will step in again to prop up the Japanese Yen. Furthermore, the Israel-Lebanon truce prompts some profit-taking around the US Dollar and exerts downward pressure on the currency pair.

Gold defends 200-day SMA at $4,425, but for how long?

Gold is attempting a tepid recovery toward $4,500 early Thursday, as renewed optimism in the Mideast geopolitical front calms market nerves. This cautious optimism across Asian markets weighs on Oil prices, and diminishes the US Dollar’s safe-haven appeal, helping Gold stage a decent comeback from the weekly low of $4,424.


Hyperliquid: ETF demand, capital rotation fuel HYPE rally as Bitcoin melts

Hyperliquid price sustains an upward trend near its all-time high of $75.76 on Thursday after posting 80% gains in May, while Bitcoin (BTC) retraces below $65,000, triggering a market-wide panic.

Kevin Warsh takes the Fed helm: What it means for the US Dollar
The Federal Reserve moves away from the highly predictable "forward guidance" model of the Jerome Powell era to a new “Kevin Warsh environment”, characterized by less communication, more policy surprises, and an increased focus on the Fed's complex balance sheet.
Recession on paper: What really moves the Canadian Loonie now?

Statistics Canada handed the headline writers a gift and the analysts a headache. Real GDP shrank 0.1% on an annualized basis in the first quarter, and with the fourth quarter of 2025 revised down to a 1.0% contraction, that is two negative quarters in a row, the textbook definition of a technical recession and Canada's first since the pandemic.