|

USD/CAD Price Analysis: Declines towards 1.3100

  • USD/CAD looks set for further breakdown as the US Dollar weakens further.
  • The underlying inflation in the US economy is clearly in a downtrend.
  • Momentum oscillators indicate more downside ahead.

The USD/CAD pair trades back and forth in a narrow range near the round-level support of 1.3200 in the early New York session. The Loonie asset struggles for a direction amid decline in volume due to shortened week.

S&P500 futures added nominal gains in the European session, portraying higher risk-appetite of the market participants. The US Dollar Index (DXY) has printed a fresh five-month low near 101.30 as investors are expecting that the Federal Reserve (Fed) would continue the rate-unwinding program from March.

A sharp decline in the underlying inflation data released on Friday indicates that price pressures are clearly in a downtrend.

The oil price recovers strongly after Russian Deputy PM Alexander Novak said their companies are sticking to their obligations on supply cuts. It is worth noting that Canada is the leading exporter of oil to the United States and higher oil prices support the Canadian Dollar.

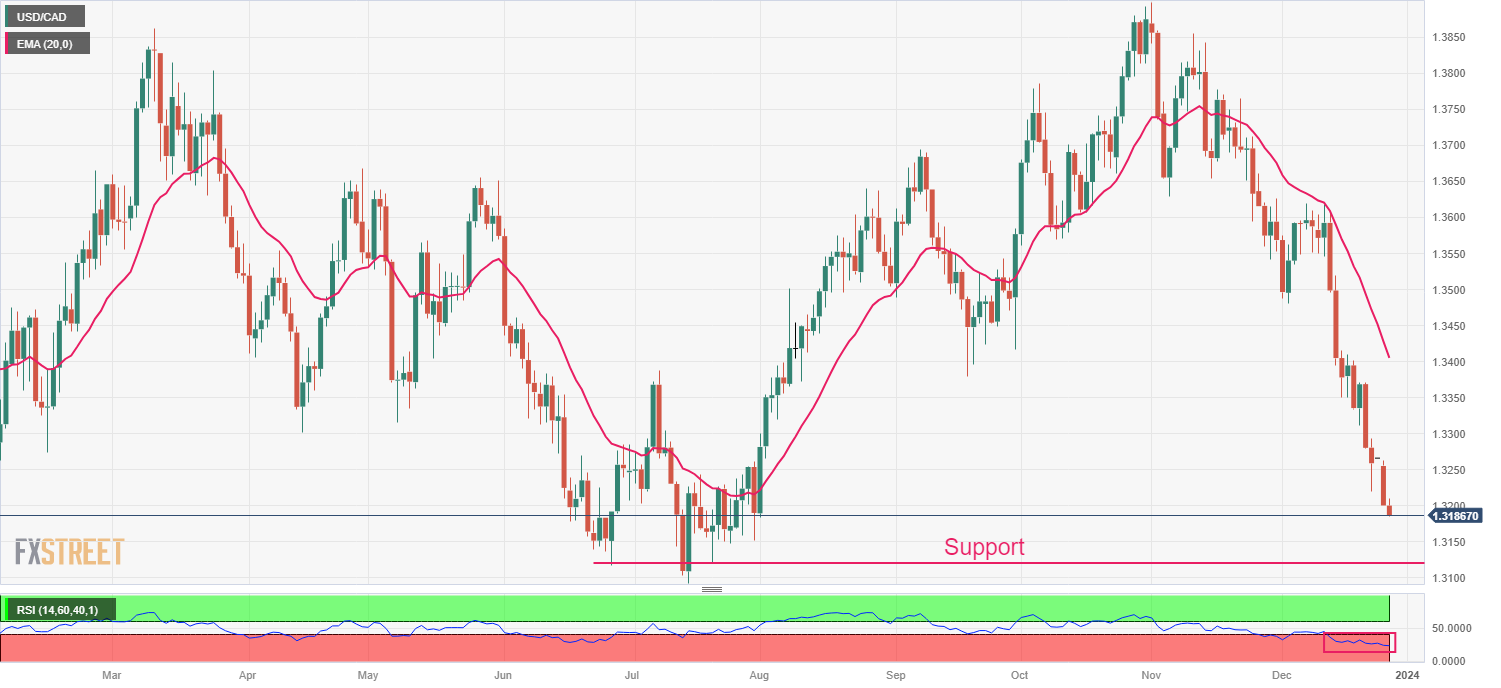
USD/CAD has been falling since the first day of November and is expected to decline further towards June 27 low, which is around 1.3117. Downward-sloping 20-day Exponential Moving Average (EMA) indicates that the near-term trend is bearish.

The Relative Strength Index (RSI) (14) hovers in the bearish range of 20.00-40.00, which indicates downside momentum is intact.

Going forward, a breakdown below intraday low of 1.3180 would expose the asset to July 25 low near 1.3150, followed by July 13 low around 1.3193.

In an alternate scenario, a recovery move above April 14 low around 1.3300 would drive the asset towards December 21 high at 1.3370. A breach of the latter would push the Loonie asset towards May 16 low at 1.3404.

USD/CAD daily chart

USD/CAD

Overview
Today last price1.3187
Today Daily Change-0.0013
Today Daily Change %-0.10
Today daily open1.32
 
Trends
Daily SMA201.3456
Daily SMA501.3626
Daily SMA1001.3595
Daily SMA2001.3495
 
Levels
Previous Daily High1.3262
Previous Daily Low1.32
Previous Weekly High1.3409
Previous Weekly Low1.3219
Previous Monthly High1.3899
Previous Monthly Low1.3541
Daily Fibonacci 38.2%1.3224
Daily Fibonacci 61.8%1.3238
Daily Pivot Point S11.3179
Daily Pivot Point S21.3158
Daily Pivot Point S31.3117
Daily Pivot Point R11.3242
Daily Pivot Point R21.3283
Daily Pivot Point R31.3304

Author

Sagar Dua

Sagar Dua

FXStreet

Sagar Dua is associated with the financial markets from his college days. Along with pursuing post-graduation in Commerce in 2014, he started his markets training with chart analysis.

More from Sagar Dua
Share:

Editor's Picks

EUR/USD hits two-day highs near 1.1820

EUR/USD picks up pace and reaches two-day tops around 1.1820 at the end of the week. The pair’s move higher comes on the back of renewed weakness in the US Dollar amid growing talk that the Fed could deliver an interest rate cut as early as March. On the docket, the flash US Consumer Sentiment improves to 57.3 in February.

GBP/USD reclaims 1.3600 and above

GBP/USD reverses two straight days of losses, surpassing the key 1.3600 yardstick on Friday. Cable’s rebound comes as the Greenback slips away from two-week highs in response to some profit-taking mood and speculation of Fed rate cuts. In addition, hawkish comments from the BoE’s Pill are also collaborating with the quid’s improvement.

Gold climbs further, focus is back to 45,000

Gold regains upside traction and surpasses the $4,900 mark per troy ounce at the end of the week, shifting its attention to the critical $5,000 region. The move reflects a shift in risk sentiment, driving flows back towards traditional safe haven assets and supporting the yellow metal.

Crypto Today: Bitcoin, Ethereum, XRP rebound amid risk-off, $2.6 billion liquidation wave

Bitcoin edges up above $65,000 at the time of writing on Friday, as dust from the recent macro-triggered sell-off settles. The leading altcoin, Ethereum, hovers above $1,900, but resistance at $2,000 caps the upside. Meanwhile, Ripple has recorded the largest intraday jump among the three assets, up over 10% to $1.35.

Three scenarios for Japanese Yen ahead of snap election

The latest polls point to a dominant win for the ruling bloc at the upcoming Japanese snap election. The larger Sanae Takaichi’s mandate, the more investors fear faster implementation of tax cuts and spending plans. 

XRP rally extends as modest ETF inflows support recovery

Ripple is accelerating its recovery, trading above $1.36 at the time of writing on Friday, as investors adjust their positions following a turbulent week in the broader crypto market. The remittance token is up over 21% from its intraday low of $1.12.