|

USD/CAD Price Analysis: Confined in a range around 1.2600 mark, remains vulnerable

  • A pickup in the USD demand, a pullback in oil prices extended some support to USD/CAD.
  • The lack of any strong follow-through buying supports prospects for further weakness.

The USD/CAD pair struggled to capitalize on its intraday bounce from the 1.2585 region and remained well within the striking distance of 34-month lows touched in the previous session.

A turnaround in the equity markets assisted the safe-haven US dollar to rebound from six-week lows. Apart from this, a pullback in crude oil prices undermined the commodity-linked loonie and provided a modest lift to the USD/CAD pair. Despite the combination of supporting factor, the pair, so far, has been struggling to attract any meaningful buying and remained confined in the overnight trading range.

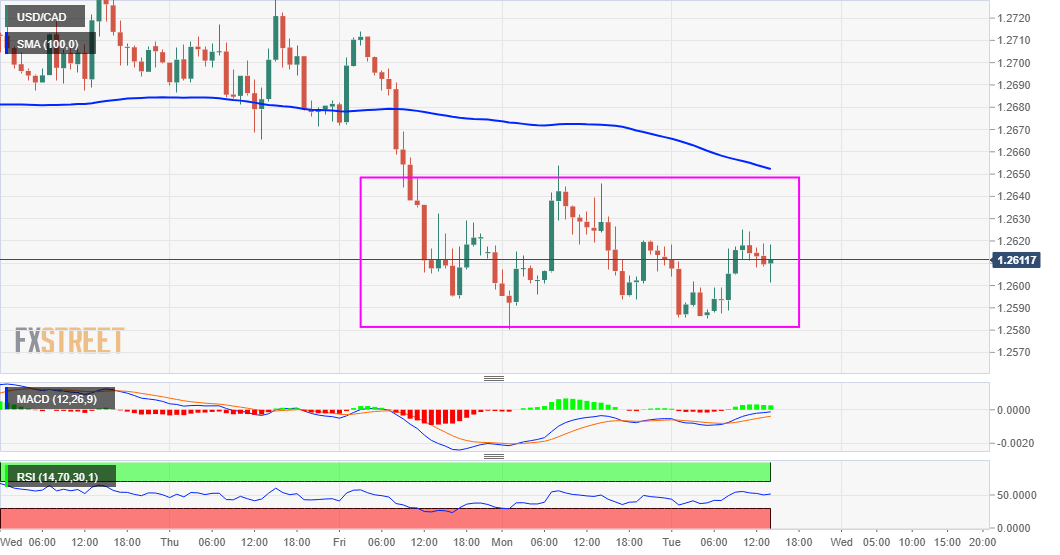
Meanwhile, the range-bound price action constitutes the formation of a rectangle, which marks a brief pause in the trend – bearish in this case. The negative outlook is reinforced by the fact that technical indicators on the daily chart are holding in the bearish territory and are still far from being in the oversold zone. This, in turn, supports prospects for an extension of the near-term downward trajectory.

A subsequent fall below multi-year lows, around the 1.2580 region will reaffirm the bearish outlook and turn the USD/CAD pair vulnerable. The next relevant target on the downside is pegged near the 1.2540 horizontal zone before the pair eventually drops to challenge the key 1.2500 psychological mark for the first time since February 2018.

On the flip side, momentum beyond the 1.2635 immediate hurdle is likely to confront stiff resistance ahead of the 1.2700 round-figure mark. A sustained strength above will be needed to negate the bearish outlook. The USD/CAD pair might then witnessed some near-term short-covering move and aim to test the next relevant resistance near the 1.2740-45 region. 

USD/CAD 1-hourly chart

fxsoriginal

Technical levels to watch

USD/CAD

Overview
Today last price1.2602
Today Daily Change-0.0017
Today Daily Change %-0.13
Today daily open1.2619
 
Trends
Daily SMA201.273
Daily SMA501.2741
Daily SMA1001.2905
Daily SMA2001.3163
 
Levels
Previous Daily High1.2654
Previous Daily Low1.258
Previous Weekly High1.2746
Previous Weekly Low1.2594
Previous Monthly High1.2881
Previous Monthly Low1.259
Daily Fibonacci 38.2%1.2626
Daily Fibonacci 61.8%1.2609
Daily Pivot Point S11.2582
Daily Pivot Point S21.2545
Daily Pivot Point S31.2509
Daily Pivot Point R11.2655
Daily Pivot Point R21.2691
Daily Pivot Point R31.2729

Author

Haresh Menghani

Haresh Menghani is a detail-oriented professional with 10+ years of extensive experience in analysing the global financial markets.

More from Haresh Menghani
Share:

Editor's Picks

EUR/USD risks a deeper drop below 1.1750

EUR/USD keeps its vacillating mood in place as the the NA session drwas to a close on Tuesday, hovering below the 1.1800 hurdle amid acceptable gains in the US Dollar. In the meantime, market participants and the FX galaxy are expected to closely follow President Trump’s SOTU speech around 2AM GMT.
 

GBP/USD regains 1.3500 and above

GBP/USD extends its advance for the third day in a row on Tuesday, this time retesting the area beyond the 1.3500 hurdle. Cable’s uptick comes despite decent gains in the Greenback and the dovish message from the BoE’s Bailey at the UK Parliament.

Gold appears offered around $5,150

Gold is giving back a good portion of the recent multi-day rally, receding to the $5,150 zone per troy ounce amid the decent bounce in the US Dollar and mixed US Treasuty yields. In the meantime, markets’ attention remain on upcoming comments from Fed speakers.

Ripple’s DeFi shift in focus: Navigating XRPL EVM sidechain growth, XRPFi migration and liquidity
Ripple (XRP) has continued to trade under pressure, extending its decline by approximately 63% from the record high of $3.66 in July. The remittance token is trading above support at $1.35, while its upside appears limited by key supply zones, starting with $1.40, at the time of writing on Tuesday.
The Citrini report: How a debatable AI narrative can shake Wall Street

That AI-related headline alone was enough to rattle investors.US stocks slid sharply on Monday after a widely circulated Citrini Research memo outlined a hypothetical “2028 Global Intelligence Crisis”, warning that rapid AI adoption could push US unemployment into double digits as early as by mid-2028.

XRP pressured by weak ETF flows and declining retail interest

Ripple (XRP) is edging lower, trading above its intraday low of $1.32 at the time of writing on Tuesday. The decline from its weekly opening of $1.39 reflects heightened volatility in the broader cryptocurrency market, accentuated by tariff-triggered uncertainty.