|

USD/CAD Price Analysis: Buyers look for entry beyond 1.4185/90

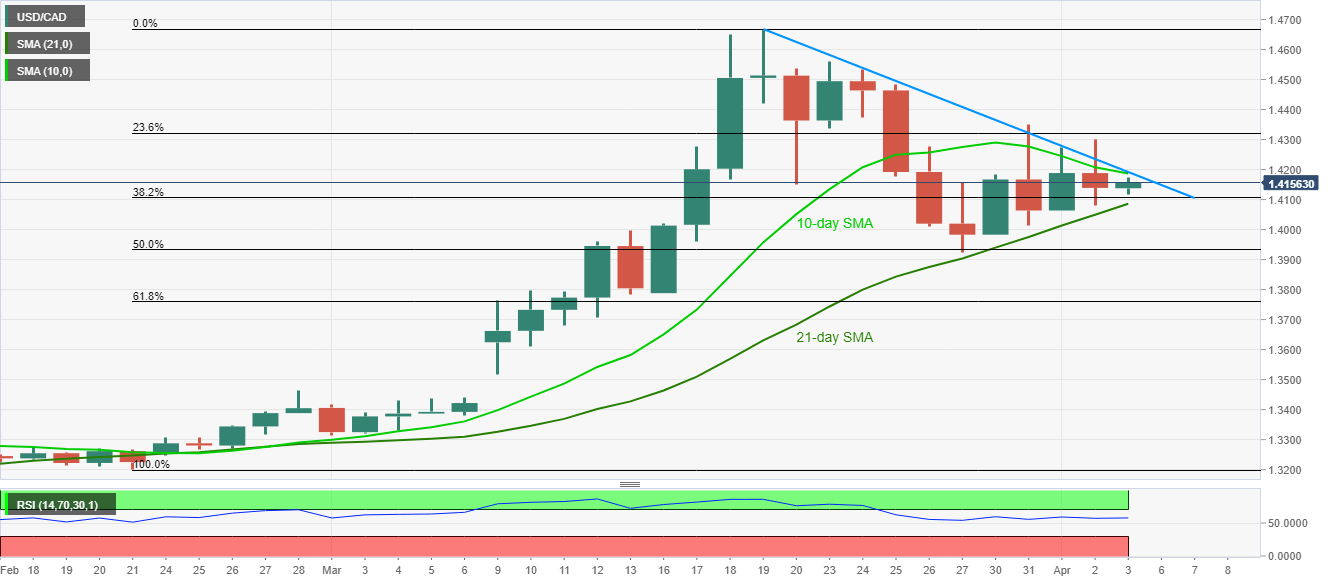
  • USD/CAD funnels down to the exit between 21-day and 10-day SMAs.
  • A two-week-old falling trend line adds strength to the resistance.
  • The late-March low will be on the bears’ radars on the downside break.

While funneling down the weekly trading range between 21/10-day SMAs, USD/CAD prints mild gains while taking the bids to 1.4155 during early Friday.

In addition to 10-day SMA, a downward sloping trend line from March 19, also guard the pair’s immediate upside around 1.4185/90.

On the downside, 1.4085 comprising 21-day SMA seems to restrict the pair’s near-term declines.

While 1.4350 is likely on the bulls’ radars on the break above 1.4190, 1.4000 can offer an intermediate halt, below 1.4085, before dragging the quote to March 27 low surrounding 1.3920.

USD/CAD daily chart

Trend: Sideways

additional important levels

Overview
Today last price1.4154
Today Daily Change15 pips
Today Daily Change %0.11%
Today daily open1.4139
 
Trends
Daily SMA201.4083
Daily SMA501.3601
Daily SMA1001.3375
Daily SMA2001.3287
 
Levels
Previous Daily High1.4299
Previous Daily Low1.4079
Previous Weekly High1.456
Previous Weekly Low1.3922
Previous Monthly High1.4668
Previous Monthly Low1.3315
Daily Fibonacci 38.2%1.4163
Daily Fibonacci 61.8%1.4215
Daily Pivot Point S11.4046
Daily Pivot Point S21.3953
Daily Pivot Point S31.3826
Daily Pivot Point R11.4265
Daily Pivot Point R21.4392
Daily Pivot Point R31.4485

Author

Anil Panchal

Anil Panchal

FXStreet

Anil Panchal has nearly 15 years of experience in tracking financial markets. With a keen interest in macroeconomics, Anil aptly tracks global news/updates and stays well-informed about the global financial moves and their implications.

More from Anil Panchal
Share:

Editor's Picks

EUR/USD looks apathetic around 1.1770

EUR/USD comes under renewed pressure on Tuesday, deflating below the 1.1800 support and reversing two consecutive days of gains. The pair’s decline follows the persistent move higher in the US Dollar, as trade uncertainty dominates the sentiment ahead of President Trump’s SOTU speech.

GBP/USD regains 1.3500 and above

GBP/USD extends its advance for the third day in a row on Tuesday, this time retesting the area beyond the 1.3500 hurdle. Cable’s uptick comes despite decent gains in the Greenback and the dovish message from the BoE’s Bailey at the UK Parliament.

Gold appears offered around $5,150

Gold is giving back a good portion of the recent multi-day rally, receding to the $5,150 zone per troy ounce amid the decent bounce in the US Dollar and mixed US Treasuty yields. In the meantime, markets’ attention remain on upcoming comments from Fed speakers.

Ripple’s DeFi shift in focus: Navigating XRPL EVM sidechain growth, XRPFi migration and liquidity

Ripple (XRP) has continued to trade under pressure, extending its decline by approximately 63% from the record high of $3.66 in July. The remittance token is trading above support at $1.35, while its upside appears limited by key supply zones, starting with $1.40, at the time of writing on Tuesday.

The Citrini report: How a debatable AI narrative can shake Wall Street

That AI-related headline alone was enough to rattle investors.US stocks slid sharply on Monday after a widely circulated Citrini Research memo outlined a hypothetical “2028 Global Intelligence Crisis”, warning that rapid AI adoption could push US unemployment into double digits as early as by mid-2028.

XRP pressured by weak ETF flows and declining retail interest

Ripple (XRP) is edging lower, trading above its intraday low of $1.32 at the time of writing on Tuesday. The decline from its weekly opening of $1.39 reflects heightened volatility in the broader cryptocurrency market, accentuated by tariff-triggered uncertainty.