USD/CAD Price Analysis: Bulls battle 13-month-old resistance below 1.2800


  • USD/CAD retreats from 10-week top, struggles to extend rebound from late October.
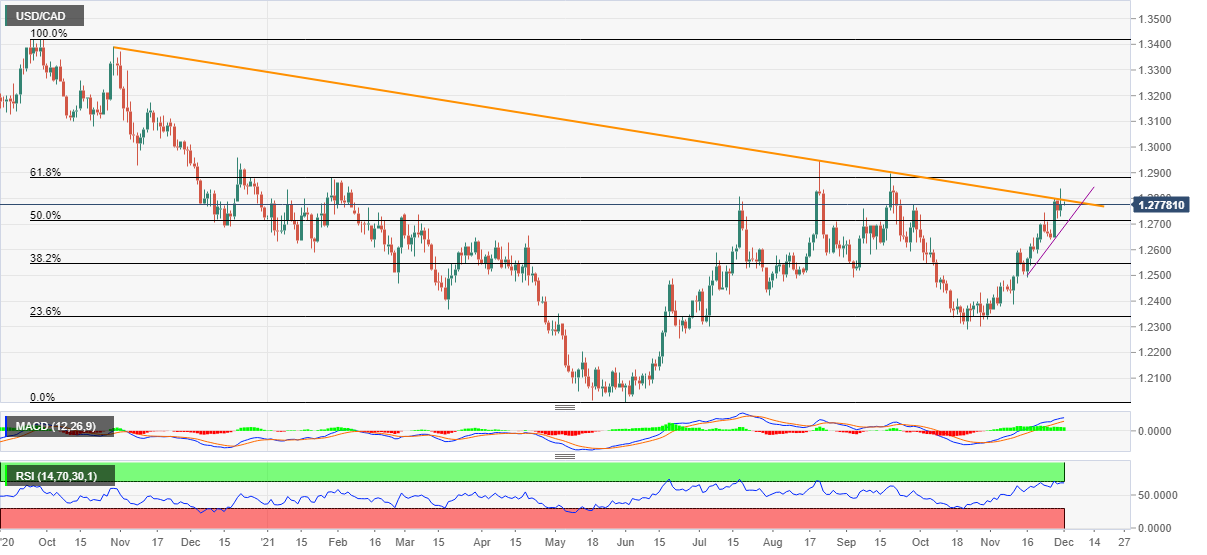
  • Bullish MACD signals, two-week-old ascending trend line favor buyers.
  • 61.8% Fibonacci retracement, tops marked in September, August also challenge buyers.

USD/CAD bulls take a breather around the highest levels since late September, easing to 1.2780 during the early Asian session on Wednesday.

In doing so, the Loonie pair steps back from a downward sloping trend line stretched from October 2020 amid overbought RSI signals. Adding to the hopes of a pullback are the multiple strong resistances that challenge the quote’s run-up beyond the stated resistance line around 1.2795.

That said, the 1.2800 threshold and 61.8% Fibonacci retracement of September 2020 to June 2021 fall, at 1.2880, offer short-term challenges to the USD/CAD pair’s upside moves.

Even if the quote rises past 1.2880, tops marked during September and August, respectively around 1.2900 and 1.2950, also offer a bumpy road to the north.

Alternatively, pullback moves remain less worrisome until staying beyond a two-week-old support line, close to 1.2690 at the latest. Before that, 50.0% Fibo. level of 1.2710 may offer nearby support.

In a case where the USD/CAD prices drop below 1.2710, April’s high around 1.2655 and the early November’s top near 1.2605 will be in focus.

USD/CAD: Daily chart

Trend: Pullback expected

Additional important levels

Overview
Today last price 1.2779
Today Daily Change 0.0025
Today Daily Change % 0.20%
Today daily open 1.2754
 
Trends
Daily SMA20 1.257
Daily SMA50 1.2533
Daily SMA100 1.2569
Daily SMA200 1.2472
 
Levels
Previous Daily High 1.2793
Previous Daily Low 1.2721
Previous Weekly High 1.28
Previous Weekly Low 1.2628
Previous Monthly High 1.2739
Previous Monthly Low 1.2288
Daily Fibonacci 38.2% 1.2749
Daily Fibonacci 61.8% 1.2766
Daily Pivot Point S1 1.2719
Daily Pivot Point S2 1.2684
Daily Pivot Point S3 1.2646
Daily Pivot Point R1 1.2791
Daily Pivot Point R2 1.2828
Daily Pivot Point R3 1.2863


Share: Feed news

Information on these pages contains forward-looking statements that involve risks and uncertainties. Markets and instruments profiled on this page are for informational purposes only and should not in any way come across as a recommendation to buy or sell in these assets. You should do your own thorough research before making any investment decisions. FXStreet does not in any way guarantee that this information is free from mistakes, errors, or material misstatements. It also does not guarantee that this information is of a timely nature. Investing in Open Markets involves a great deal of risk, including the loss of all or a portion of your investment, as well as emotional distress. All risks, losses and costs associated with investing, including total loss of principal, are your responsibility. The views and opinions expressed in this article are those of the authors and do not necessarily reflect the official policy or position of FXStreet nor its advertisers. The author will not be held responsible for information that is found at the end of links posted on this page.

If not otherwise explicitly mentioned in the body of the article, at the time of writing, the author has no position in any stock mentioned in this article and no business relationship with any company mentioned. The author has not received compensation for writing this article, other than from FXStreet.

FXStreet and the author do not provide personalized recommendations. The author makes no representations as to the accuracy, completeness, or suitability of this information. FXStreet and the author will not be liable for any errors, omissions or any losses, injuries or damages arising from this information and its display or use. Errors and omissions excepted.

The author and FXStreet are not registered investment advisors and nothing in this article is intended to be investment advice.

Recommended content


Recommended content

Editors’ Picks

AUD/USD could extend the recovery to 0.6500 and above

AUD/USD could extend the recovery to 0.6500 and above

The enhanced risk appetite and the weakening of the Greenback enabled AUD/USD to build on the promising start to the week and trade closer to the key barrier at 0.6500 the figure ahead of key inflation figures in Australia.

AUD/USD News

EUR/USD now refocuses on the 200-day SMA

EUR/USD now refocuses on the 200-day SMA

EUR/USD extended its positive momentum and rose above the 1.0700 yardstick, driven by the intense PMI-led retracement in the US Dollar as well as a prevailing risk-friendly environment in the FX universe.

EUR/USD News

Gold struggles around $2,325 despite broad US Dollar’s weakness

Gold struggles around $2,325 despite broad US Dollar’s weakness

Gold reversed its direction and rose to the $2,320 area, erasing a large portion of its daily losses in the process. The benchmark 10-year US Treasury bond yield stays in the red below 4.6% following the weak US PMI data and supports XAU/USD.

Gold News

Bitcoin price makes run for previous cycle highs as Morgan Stanley pushes BTC ETF exposure

Bitcoin price makes run for previous cycle highs as Morgan Stanley pushes BTC ETF exposure

Bitcoin (BTC) price strength continues to grow, three days after the fourth halving. Optimism continues to abound in the market as Bitcoiners envision a reclamation of previous cycle highs.

Read more

US versus the Eurozone: Inflation divergence causes monetary desynchronization

US versus the Eurozone: Inflation divergence causes monetary desynchronization

Historically there is a very close correlation between changes in US Treasury yields and German Bund yields. This is relevant at the current juncture, considering that the recent hawkish twist in the tone of the Federal Reserve might continue to push US long-term interest rates higher and put upward pressure on bond yields in the Eurozone. 

Read more

Forex MAJORS

Cryptocurrencies

Signatures