USD/CAD Price Analysis: Bears lurking with eyes on a deeper correction
- The daily chart's W-formation is a bearish feature.
- The hourly chart's price action is coiling for a breakout.

USD/CAD burst through an hourly trendline resistance on Friday and is now consolidating in a phase of price discovery. The following illustrates the market structure and prospects of a deeper retracement for the coming sessions:
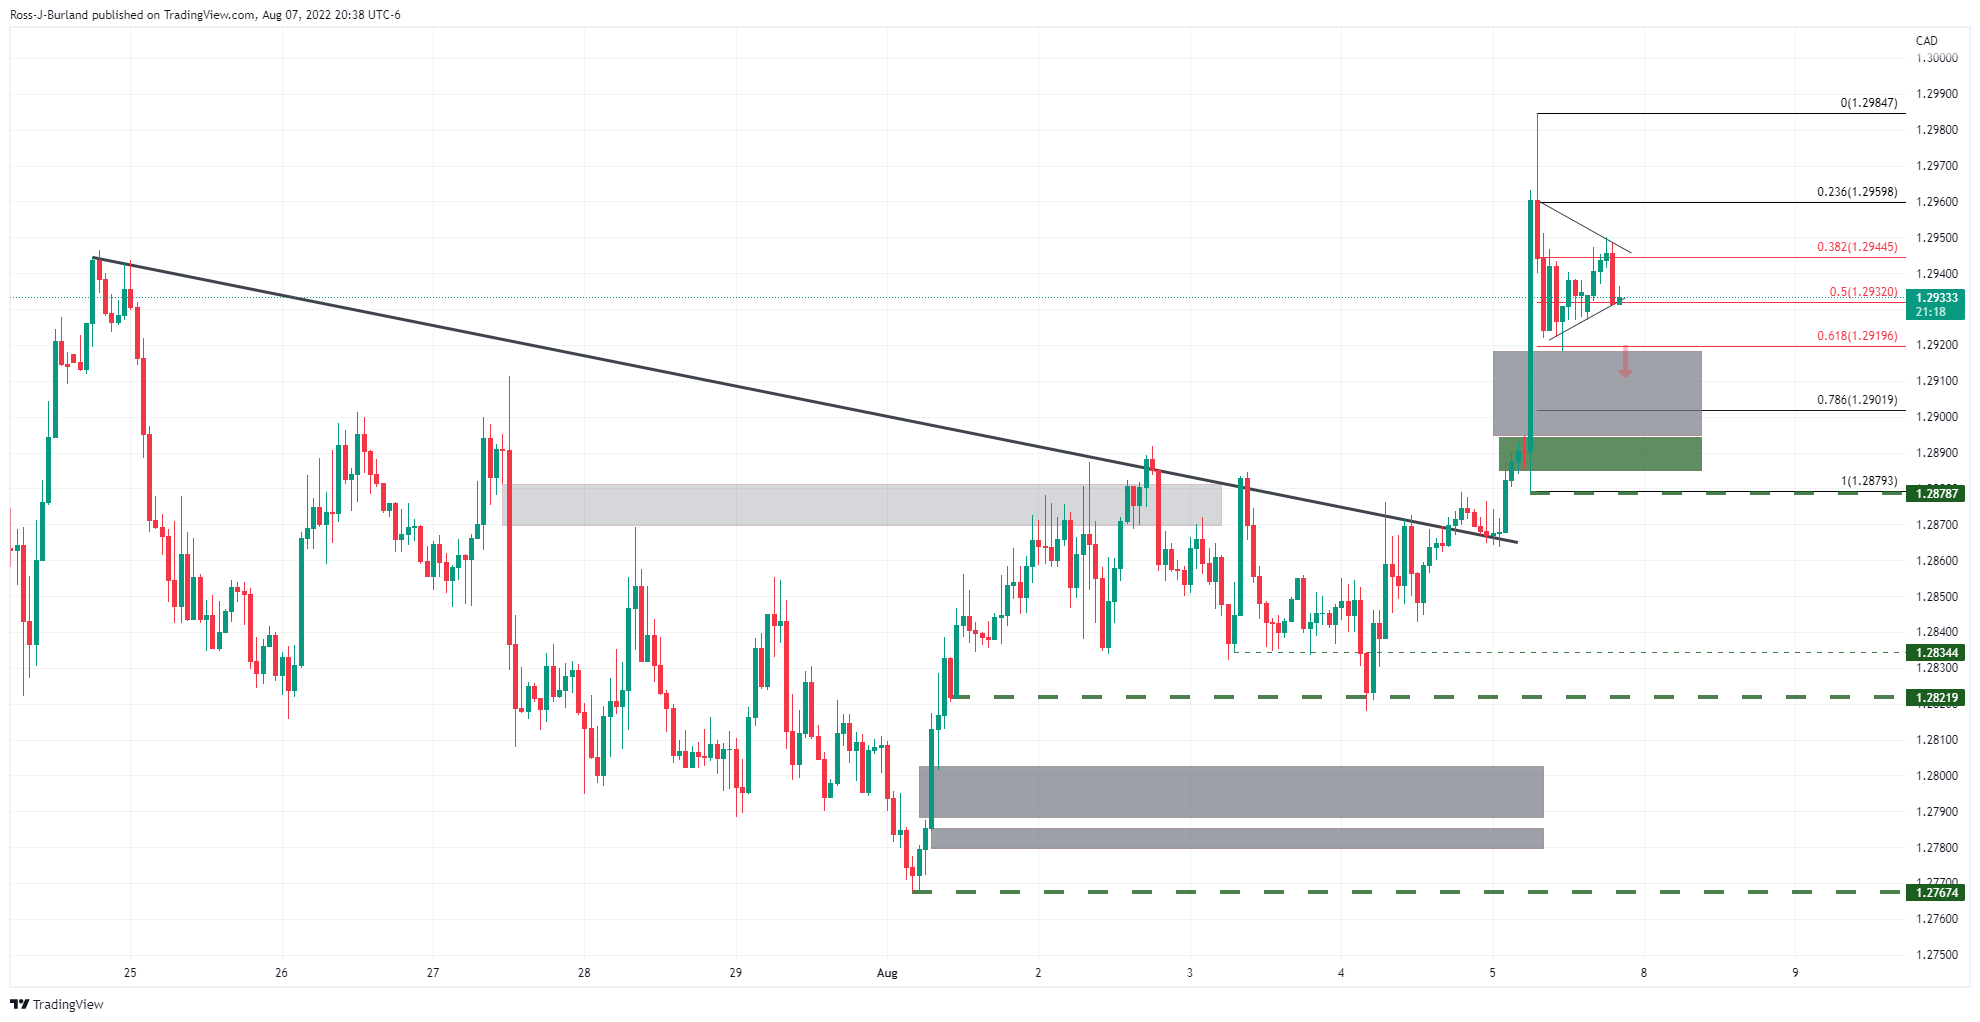
As illustrated, the price has burst through the trendline resistance and the price is coiling between support and resistance. A break to the downside opens the probability of a move into the area of price imbalance. 1.2880 is a potentially key structure that if broken may give way to a deeper correction towards 1.2820 and 1.2770. On the other hand, considering the price has already corrected 61.8% of the impulse, should the bulls commit, an upside breakout and extension could be around the corner.
USD/CAD daily chart
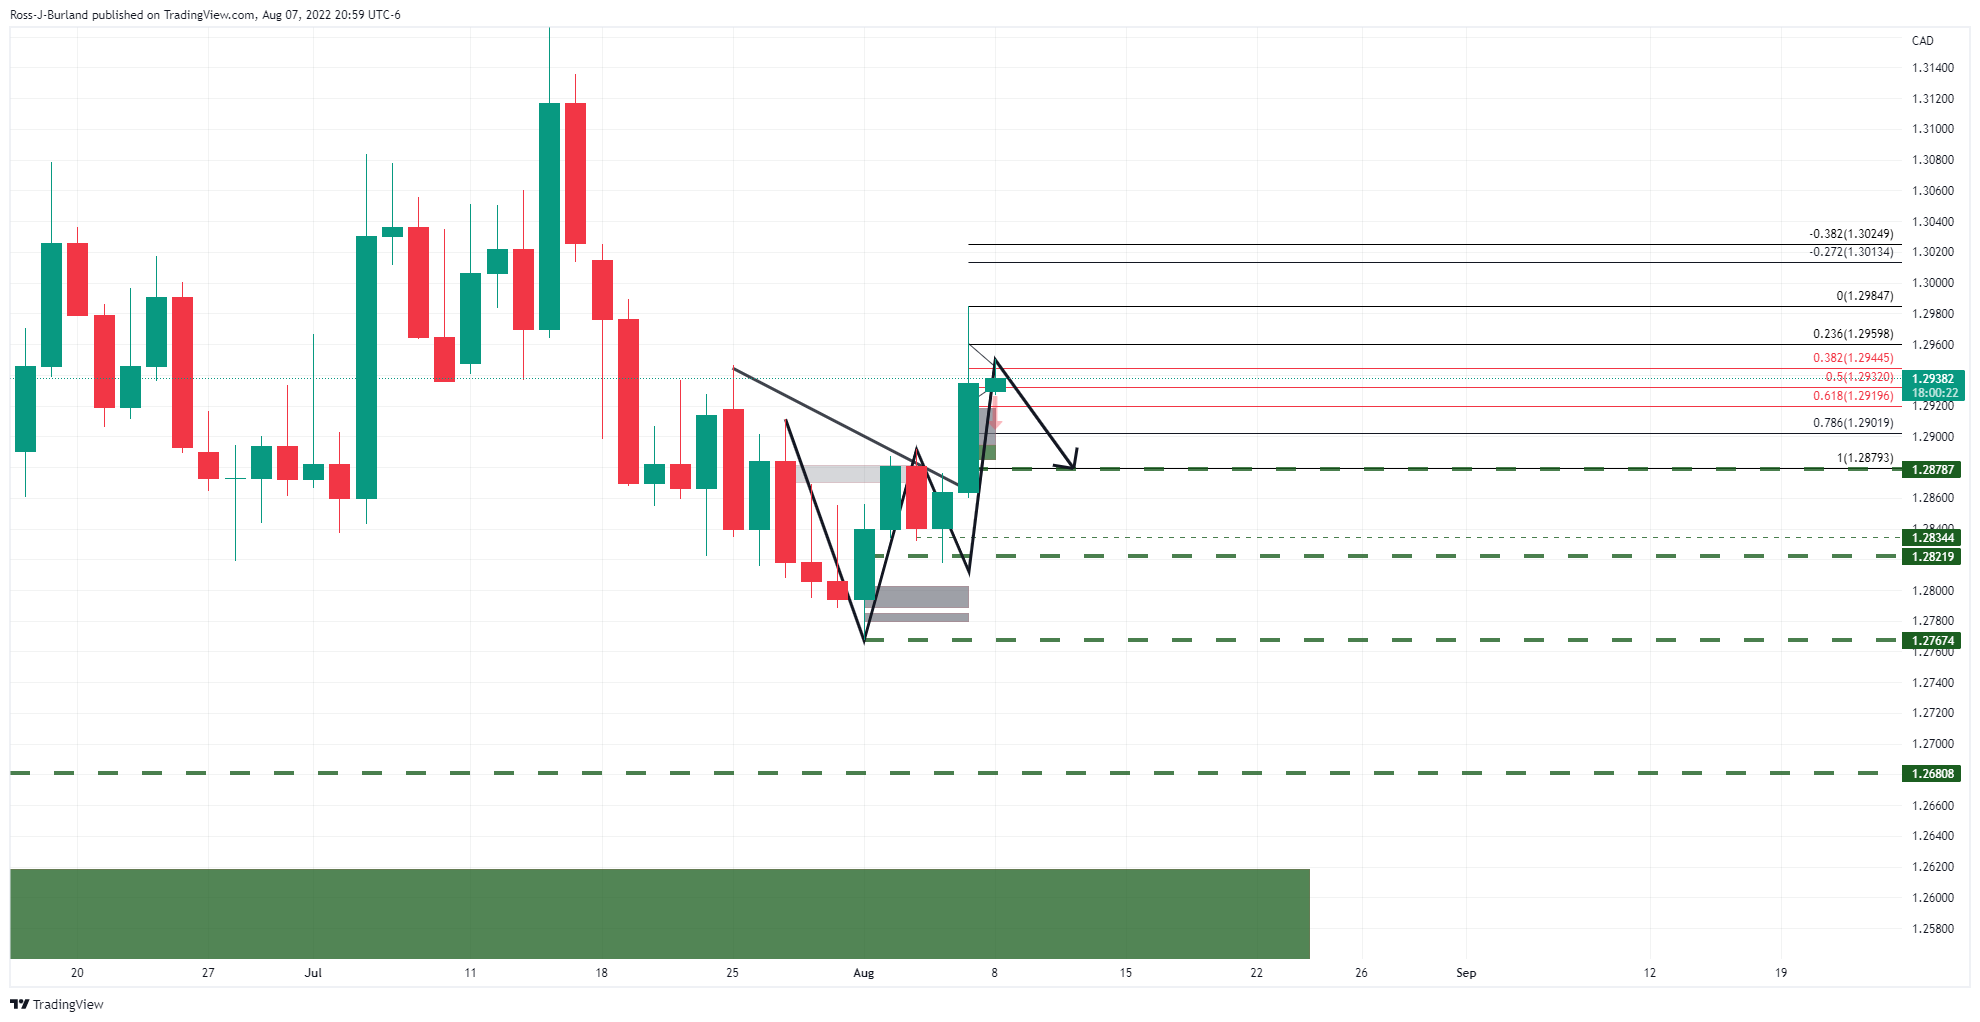
The daily chart's W-formation is a bearish feature with price anticipated to correct the daily bullish impulse towards the neckline.
Author

Ross J Burland
FXStreet
Ross J Burland, born in England, UK, is a sportsman at heart. He played Rugby and Judo for his county, Kent and the South East of England Rugby team.


