USD/CAD Price Analysis: Bears flirt with 100-DMA/50% Fibo. confluence, below mid-1.2600s


Share:
  • USD/CAD struggled to capitalize on the overnight bounce and met with a fresh supply on Tuesday.
  • The technical set-up supports prospects for an extension of the recent pullback from a one-year high.
  • Bears, however, might wait for a convincing break below the 1.2600 mark before placing fresh bets.

The USD/CAD pair struggled to capitalize on the previous day's goodish rebound from the vicinity of the 1.2600 mark, or a one-month low and met with a fresh supply on Tuesday. The pair maintained its offered tone through the first half of the European session and was last seen trading just below mid-1.2600s.

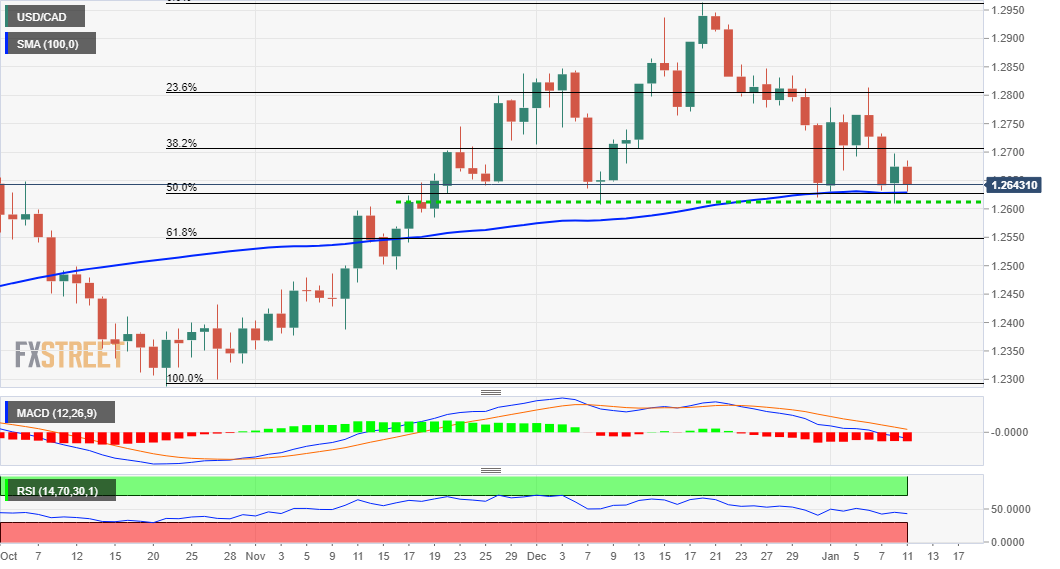
From a technical perspective, the USD/CAD pair, so far, has managed to hold its neck above confluence support comprising of 100-day SMA and the 50% Fibonacci level of the 1.2288-1.2964 move up. This is closely followed by the overnight swing low, which if broken will be seen as a fresh trigger for bearish traders.

Given that oscillators on the daily chart have started gaining negative traction, a convincing break below will set the stage for an extension of the recent pullback from a one-year high set in December. The USD/CAD pair might then accelerate the fall to the 1.2540 area (61.8% Fibo.) en-route the key 1.2500 psychological mark.

On the flip side, the overnight swing high, around the 1.2700 mark, which coincides with the 38.2% Fibo. level, now seems to act as an immediate strong barrier. Some follow-through buying might push spot prices towards the 1.2755-60 horizontal resistance, above which bulls could aim to conquer the 1.2800 mark.

The latter also represents the 23.6% Fibo. level hurdle and should act as a key pivotal point for traders. A sustained strength beyond might negate any near-term negative bias and trigger a short-covering move, which might push the USD/CAD pair towards the next relevant hurdle near the 1.2860 horizontal zone.

USD/CAD daily chart

fxsoriginal

Levels to watch

USD/CAD

Overview
Today last price 1.2644
Today Daily Change -0.0030
Today Daily Change % -0.24
Today daily open 1.2674
 
Trends
Daily SMA20 1.2787
Daily SMA50 1.2694
Daily SMA100 1.2628
Daily SMA200 1.2503
 
Levels
Previous Daily High 1.2698
Previous Daily Low 1.261
Previous Weekly High 1.2814
Previous Weekly Low 1.2631
Previous Monthly High 1.2964
Previous Monthly Low 1.2608
Daily Fibonacci 38.2% 1.2664
Daily Fibonacci 61.8% 1.2644
Daily Pivot Point S1 1.2624
Daily Pivot Point S2 1.2573
Daily Pivot Point S3 1.2536
Daily Pivot Point R1 1.2711
Daily Pivot Point R2 1.2748
Daily Pivot Point R3 1.2799


Share: Feed news

Information on these pages contains forward-looking statements that involve risks and uncertainties. Markets and instruments profiled on this page are for informational purposes only and should not in any way come across as a recommendation to buy or sell in these assets. You should do your own thorough research before making any investment decisions. FXStreet does not in any way guarantee that this information is free from mistakes, errors, or material misstatements. It also does not guarantee that this information is of a timely nature. Investing in Open Markets involves a great deal of risk, including the loss of all or a portion of your investment, as well as emotional distress. All risks, losses and costs associated with investing, including total loss of principal, are your responsibility. The views and opinions expressed in this article are those of the authors and do not necessarily reflect the official policy or position of FXStreet nor its advertisers. The author will not be held responsible for information that is found at the end of links posted on this page.

If not otherwise explicitly mentioned in the body of the article, at the time of writing, the author has no position in any stock mentioned in this article and no business relationship with any company mentioned. The author has not received compensation for writing this article, other than from FXStreet.

FXStreet and the author do not provide personalized recommendations. The author makes no representations as to the accuracy, completeness, or suitability of this information. FXStreet and the author will not be liable for any errors, omissions or any losses, injuries or damages arising from this information and its display or use. Errors and omissions excepted.

The author and FXStreet are not registered investment advisors and nothing in this article is intended to be investment advice.

Follow us on Telegram

Stay updated of all the news

Join Telegram

Recommended content


Follow us on Telegram

Stay updated of all the news

Join Telegram

Recommended content

Editors’ Picks

EUR/USD closes in on 1.0700 amid broad USD strength

EUR/USD closes in on 1.0700 amid broad USD strength

EUR/USD came under renewed bearish pressure in the American session and dropped to its lowest level since late March near 1.0700. Stronger-than-forecast PCE inflation data and hawkish comments from Fed's Mester provide a boost to the US Dollar and weigh on the pair.

EUR/USD News

GBP/USD loses bullish momentum after US data, falls below 1.2350

GBP/USD loses bullish momentum after US data, falls below 1.2350

GBP/USD has reversed its direction and erased a large portion of its daily gains on Friday after the data from the US showed that the annual core PCE inflation edged higher to 4.7% in April. Although the pair clings to small daily gains below 1.2350, it remains on track to end the third straight week in negative territory.

GBP/USD News

Gold erases daily gains, holds above $1,940

Gold erases daily gains, holds above $1,940

Gold price turned south and declined to the $1,940 area in the American session on Friday. The benchmark 10-year US Treasury bond yield holds stead above 3.8% after stronger-than-expected core PCE inflation data from the US, not allowing XAU/USD to gain traction.

Gold News

Ethereum price to outpace Bitcoin price as ETH jumps over key hurdle where BTC fumbles

Ethereum price to outpace Bitcoin price as ETH jumps over key hurdle where BTC fumbles

ETH is working on its recovery after it dipped to a two-week low on Thursday. While Bitcoin price has failed to make a similar move and head back above $26,500, Ethereum is outpacing Bitcoin and has been able to push above $1,800.

Read more

Ford Stock: New agreement will give customers access to 12,000 Tesla chargers

Ford Stock: New agreement will give customers access to 12,000 Tesla chargers

Ford (F) stock has advanced about 2.5% early Friday following CEO Chris Farley’s announcement that Ford owners will be able to charge their EVs at Tesla Superchargers beginning in early 2024.

Read more

Forex MAJORS

Cryptocurrencies

Signatures