USD/CAD Price Analysis: Bears eye a significant correction for the days ahead
- USD/CAD bears could be on the prowl and eyes are on the downside.
- The W-formation is a compelling feature of the daily chart.

USD/CAD has extended its rally and is reaching prior highs that would be expected to act as a resistance and potentially lead to a significant correction of the bullish impulse. The following illustrates the prospects of a correction for the coming sessions that could target key areas of potential support.
USD/CAD daily chart
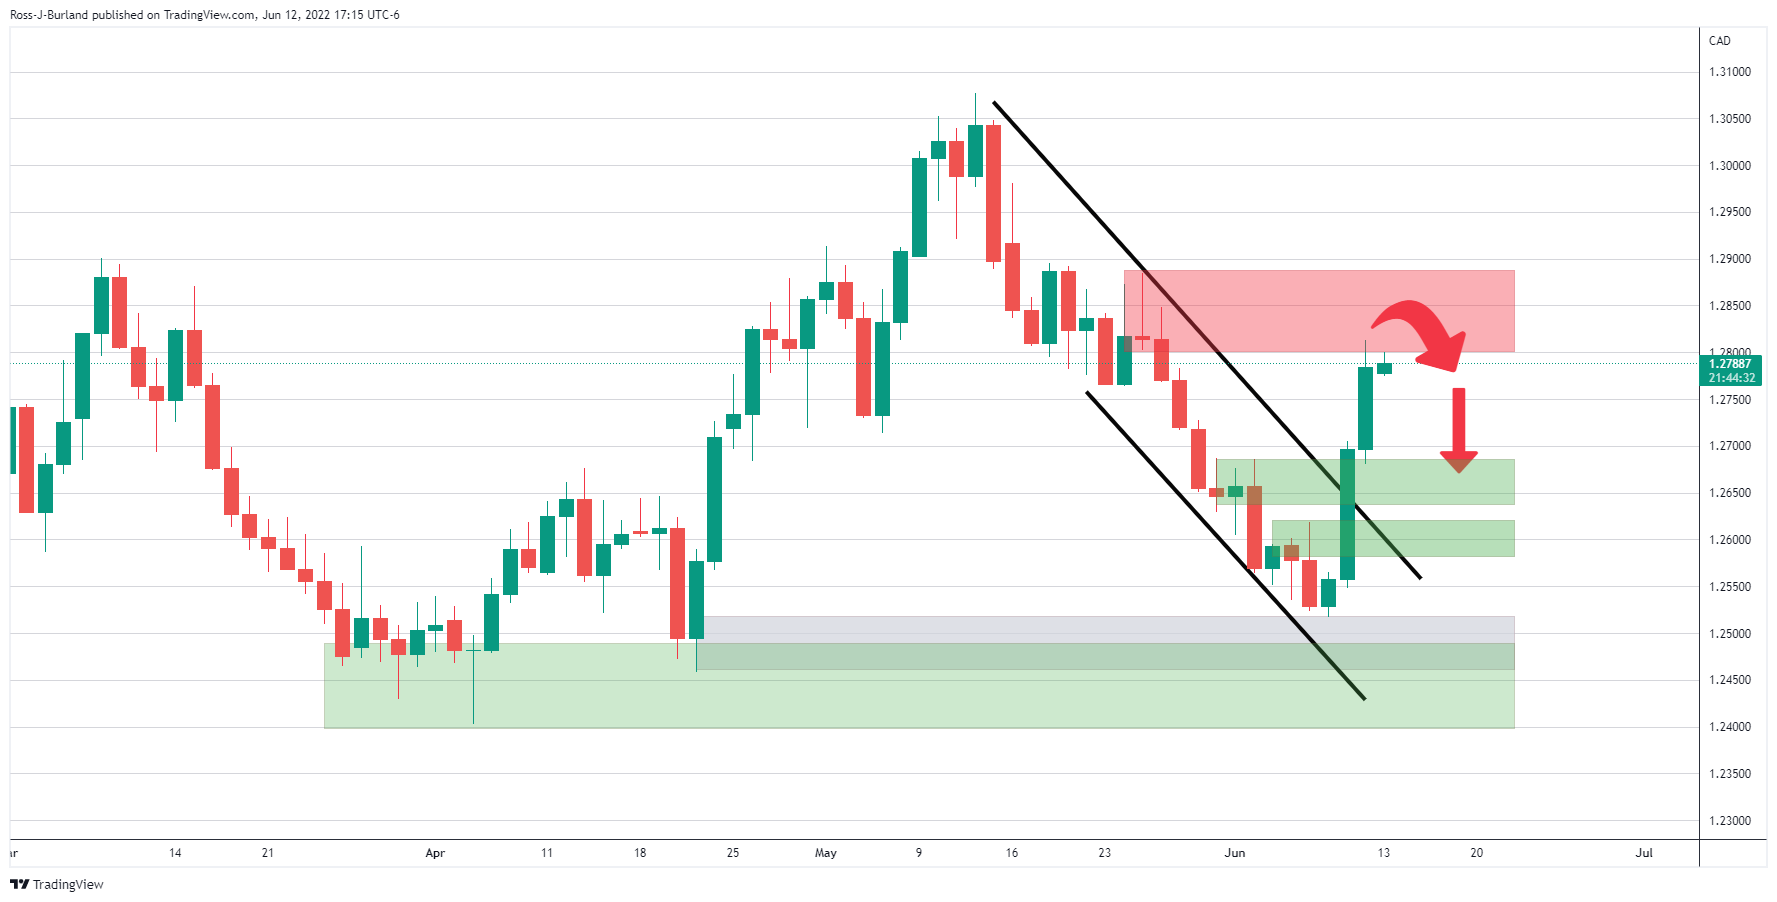
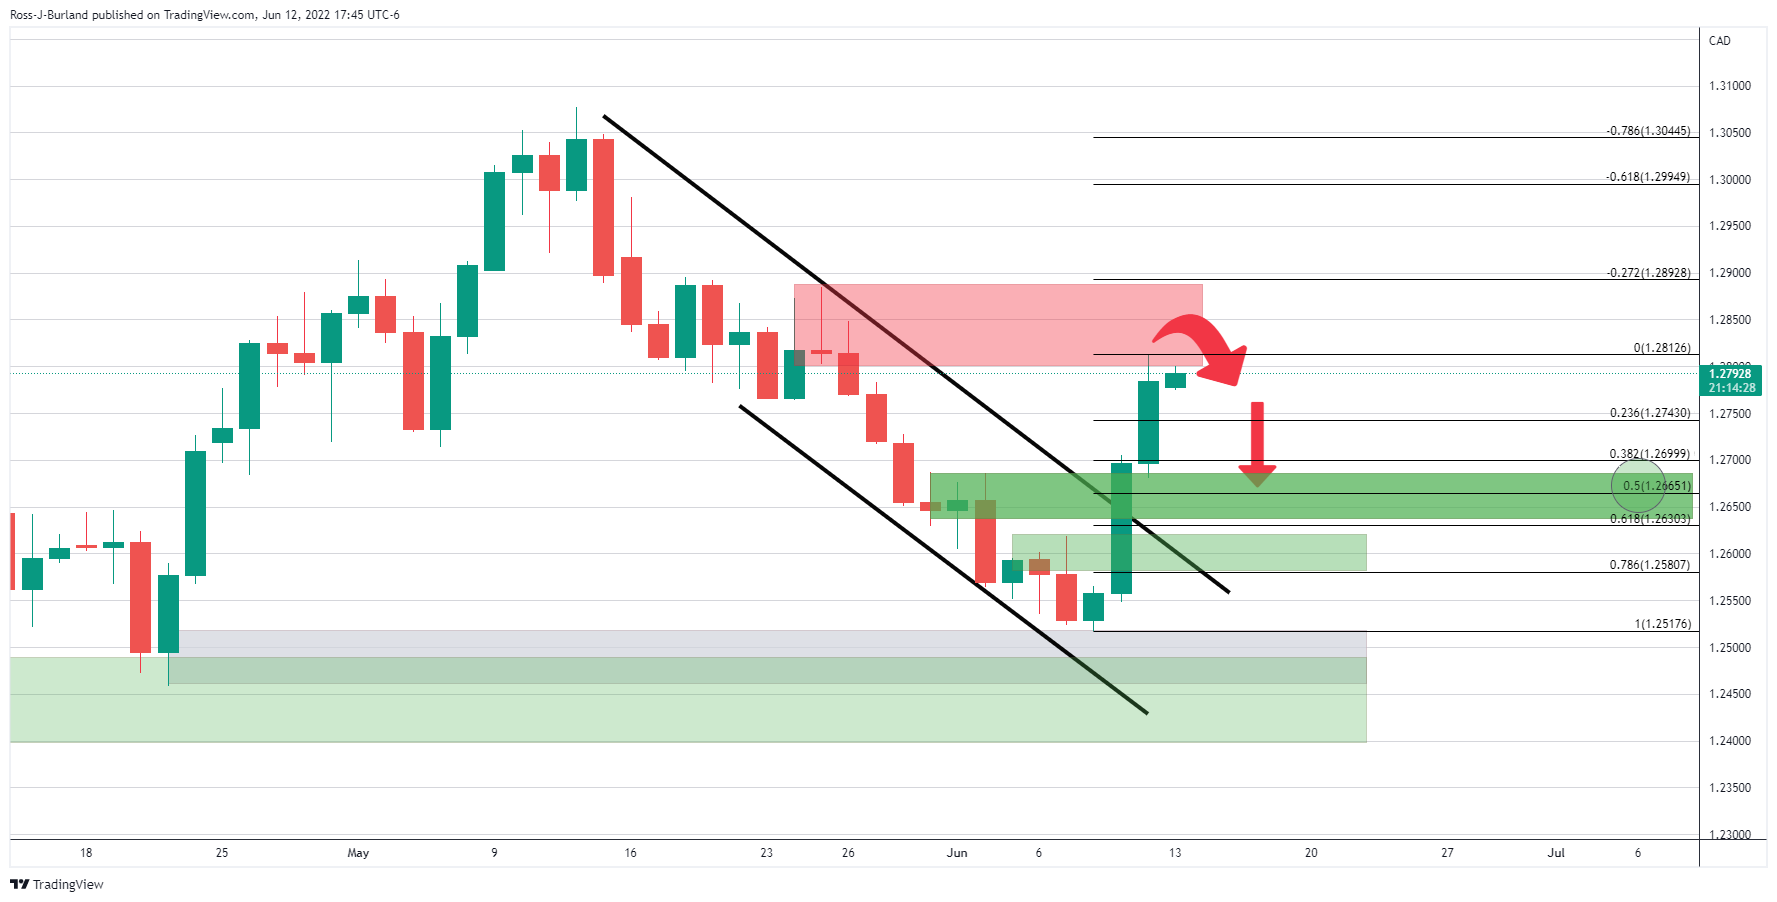
The price formation is an over-extended W-pattern, a reversion pattern that would be expected to see the USD/CAD slide back towards the neckline, or in this case, only as far as the structure near 1.2680 as the prior structure. Once the rally decelerates, the Fibonacci retracement tool can be drawn on the bullish impulse to compare to where the levels meet the structure for additional confluence. As it stands, based on the current range of the rally so far, the 50% mean reversion level meets with the structure between 1.2680 and 1.2650:
Author

Ross J Burland
FXStreet
Ross J Burland, born in England, UK, is a sportsman at heart. He played Rugby and Judo for his county, Kent and the South East of England Rugby team.


