|

USD/CAD Price Analysis: Battles at the 20-day EMA, drops toward 1.3530s

  • USD/CAD struggles at the 20-day EMA and tumbles towards the 1.3530 area.
  • USD/CAD Price Analysis: Oscillators offering mixed signals, but price action stalling at crucial EMAs to keep the pair rangebound.

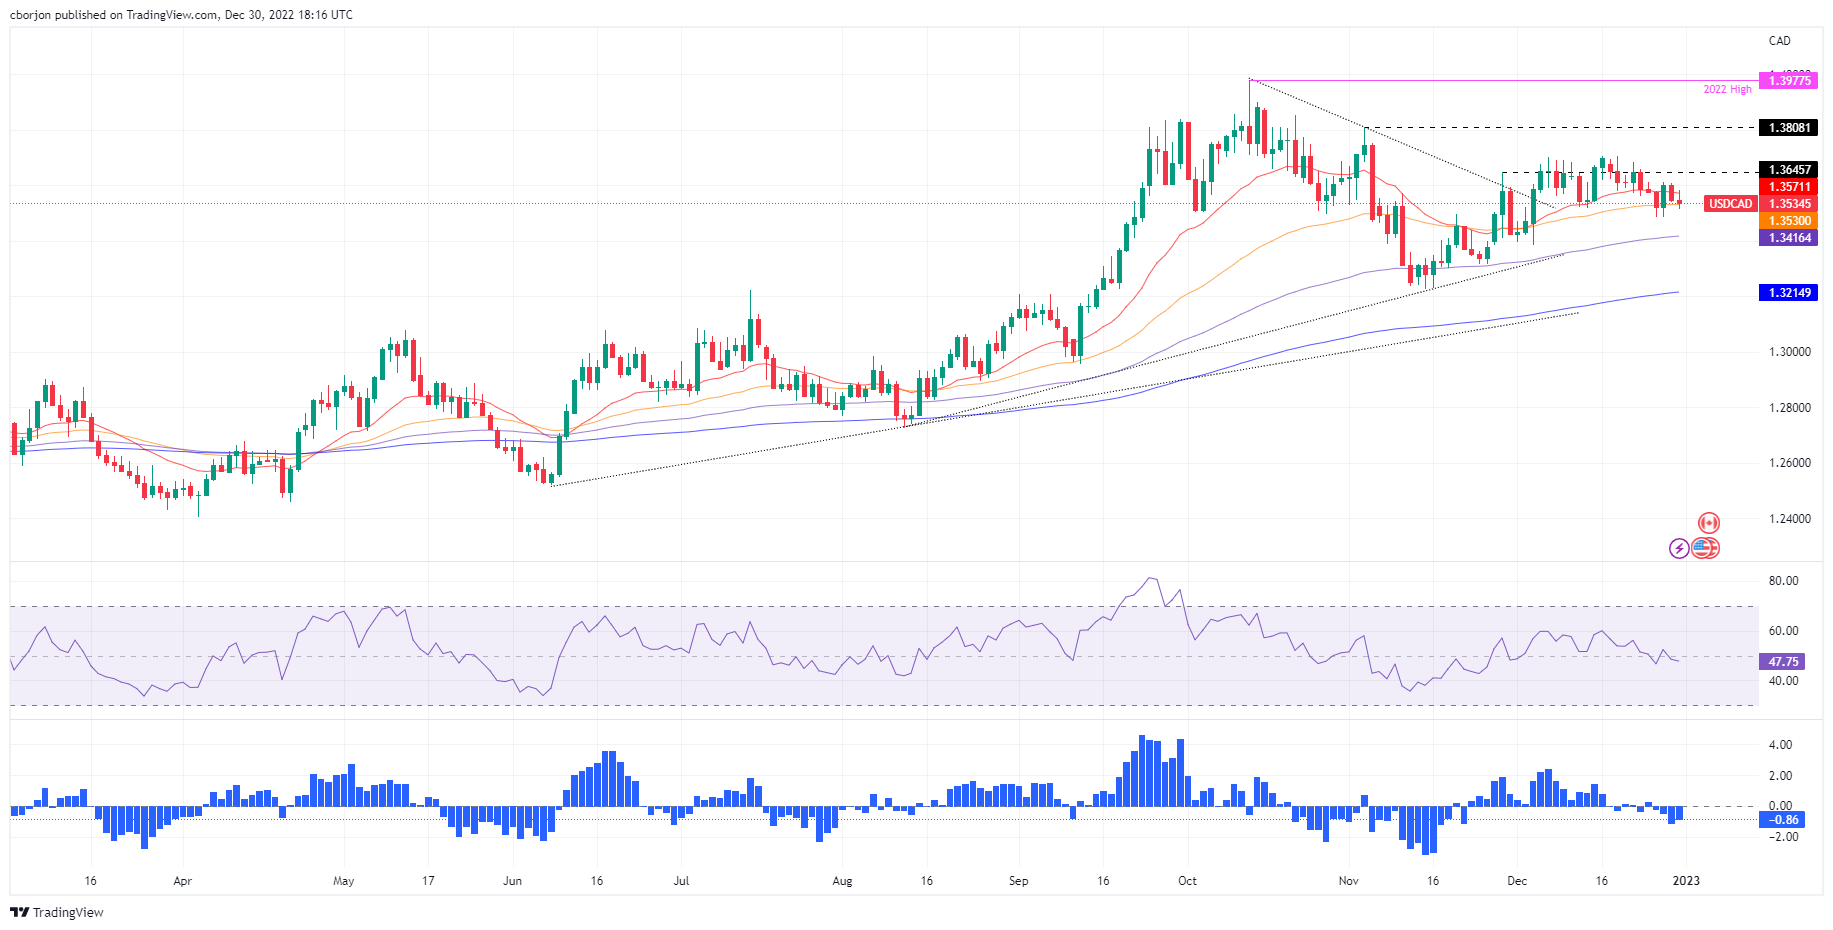
The USD/CAD advance stalled at the 20-day Exponential Moving Average (EMA) at 1.3570 and dropped toward the 50-day EMA as the US Dollar (USD) weakened, while crude oil extended its recovery, a tailwind for the Canadian Dollar (CAD). At the time of writing, the USD/CAD is trading at 1.3530.

USD/CAD Price Analysis: Technical outlook

From a daily chart perspective, the USD/CAD dropped to fresh two-day lows but shy of the weekly low of 1.3484. During the last five trading days, the 20-day Exponential Moving Average (EMA), around 1.3570, capped the USD/CAD recovery towards the 1.3700 figure. And since mid-December, the USD/CAD embarked on successive series of lower highs/lows as the major consolidated ahead of the year’s end.

The Relative Strength Index (RSI), at bearish territory, keeps USD/CAD sellers hopeful for further downside, while the Rate of Change (RoC), suggests selling pressure is waning. Therefore, unless the USD/CAD decisively breaks below 1.3484, that could open the door for further losses. The next support would be the 100-day EMA at 1.3416, ahead of the 1.3400 figure, and the 200-day EMA at 1.3215.

As an alternative scenario, the USD/CAD first resistance would be the 20-day EMA at 1.3570. Once cleared, the next resistance would be 1.3600, followed by the 1.3700 mark.

USD/CAD Key Technical Levels

USD/CAD

Overview
Today last price1.353
Today Daily Change-0.0013
Today Daily Change %-0.10
Today daily open1.3543
 
Trends
Daily SMA201.3604
Daily SMA501.3529
Daily SMA1001.3437
Daily SMA2001.3116
 
Levels
Previous Daily High1.3611
Previous Daily Low1.3538
Previous Weekly High1.3704
Previous Weekly Low1.3563
Previous Monthly High1.3808
Previous Monthly Low1.3226
Daily Fibonacci 38.2%1.3566
Daily Fibonacci 61.8%1.3583
Daily Pivot Point S11.3517
Daily Pivot Point S21.3491
Daily Pivot Point S31.3444
Daily Pivot Point R11.359
Daily Pivot Point R21.3637
Daily Pivot Point R31.3663

Author

Christian Borjon Valencia

Markets analyst, news editor, and trading instructor with over 14 years of experience across FX, commodities, US equity indices, and global macro markets.

More from Christian Borjon Valencia
Share:

Editor's Picks

AUD/USD holds the bounce near 0.7050 after China trade data

AUD/USD is holding the bounce from two-month lows, retesting 0.7050 in the Asian session on Tuesday. Easing tensions in the Middle East keep the US Dollar on the defensive, supporting the pair amid China's trade surplus expansion in May.

USD/JPY consolidates above 160.00 amid intervention fears, Israel-Iran ceasefire

USD/JPY holds steady above 160.00 during the Asian session on Tuesday as expectations that authorities will step in again to prop up the Japanese Yen hold back bulls from placing fresh bets. Moreover, a de-escalation of tensions between Israel and Iran undermines the safe-haven US Dollar, capping the currency pair. Traders also seem hesitant and opt to wait for the release of the latest US inflation figures on Wednesday and Thursday.

Gold draws support from weaker USD; bulls seem hesitant amid Fed hike bets

Gold extends its sideways consolidative price move through the Asian session, and remains close to the lowest level since March 23, around the $4,268-$4,267 region touched the previous day. The US Dollar retreated from an over two-month high after Iran and Israel said on Monday they had ​halted attacks on each other following an appeal from US President Donald Trump.

XRP and XLM outlook: Fragile recovery as traders favor downside

Ripple and Stellar remain under pressure on Tuesday after a mild recovery following a massive correction in the previous week. Weakening derivatives positioning, alongside mixed on-chain data for both XRP and XLM, suggests that any recovery rallies are likely viewed as corrective within a broader bearish context. Derivatives data shows a bearish tilt.

Upbeat NFP data sets the market up for CPI test

Investors sought safety toward the US dollar after the latest NFP report triggered risk-off trading across the markets. The US Dollar Index which tracks the dollar strength against a basket currencies recorded one of it’s best weeks in recent times.

The US economy defies the rules: 100 days into the Oil shock and the recession signal is still missing

More than three months after the start of the Iran war and the resulting disruption to global energy markets, the US economy continues to display remarkable resilience. The conflict has triggered a sharp rise in Oil prices, reignited inflationary pressures and fueled widespread concerns about a potential economic slowdown.