|

USD/CAD Price Analysis: At make or a break below 1.3600

  • USD/CAD is oscillating in a narrow range below 1.3600 amid a quiet market mood.
  • This week, US Employment-linked economic indicators will keep investors busy.
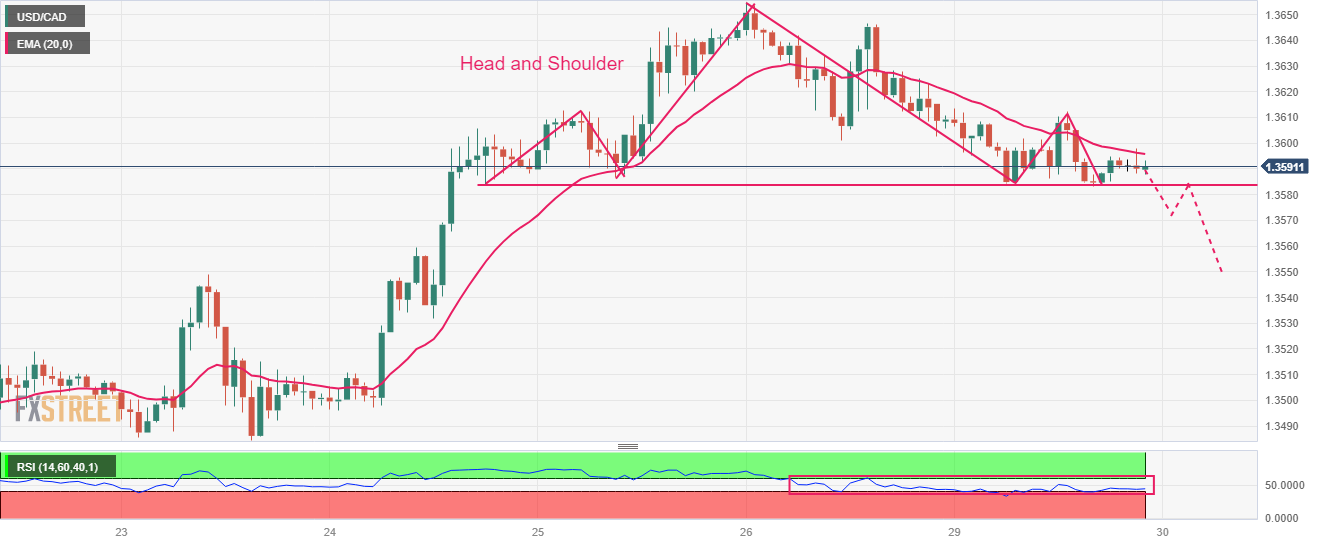
  • USD/CAD is hovering near the neckline of the Head and Shoulder chart pattern around 1.3584.

The USD/CAD pair is juggling in a narrow range below the round-level resistance of 1.3600 in the early Tokyo session. The Loonie asset is expected to display a power-pack action as investors would remain highly active after an extended weekend.

As US debt-ceiling raise proposal is finally going to Congress for approval before June 05, investors would shift their focus towards United States Employment-linked economic indicators. After Wednesday’s JOLTS Job Openings data, investors will focus on Thursday’s Automatic Data Processing (ADP) Employment Change and finally on Friday’s Nonfarm Payrolls (NFP) data.

The Canadian Dollar is expected to remain on the tenterhooks amid the release of the Q1 Gross Domestic Product (GDP) data, which will release on Wednesday.

Meanwhile, the US Dollar Index (DXY) has dropped after facing stiff barricades around 104.30.

USD/CAD is hovering near the neckline of the Head and Shoulder chart pattern formed on an hourly scale, which is plotted around 1.3584. A slippage below the neckline support would result in a sheer breakdown. The 20-period Exponential Moving Average (EMA) at 1.3596 is acting as a barricade for the US Dollar bulls.

Meanwhile, the Relative Strength Index (RSI) (14) is oscillating in the 40.00-60.00 range. A downside momentum will get triggered after a breakdown below 40.00.

Going forward, a break below May 29 low at 1.3584 will drag the asset toward May 23 high at 1.3550. A breakdown below the latter will expose the Loonie asset to psychological support at 1.3500.

On the contrary, a fresh buy would come above May 26 high at 1.3655, which would drive the asset toward the round-level resistance at 1.3700 followed by March 27 high at 1.3745.

USD/CAD hourly chart

USD/CAD

Overview
Today last price1.359
Today Daily Change-0.0027
Today Daily Change %-0.20
Today daily open1.3617
 
Trends
Daily SMA201.3507
Daily SMA501.3525
Daily SMA1001.3511
Daily SMA2001.3493
 
Levels
Previous Daily High1.3655
Previous Daily Low1.3601
Previous Weekly High1.3655
Previous Weekly Low1.3485
Previous Monthly High1.3668
Previous Monthly Low1.3301
Daily Fibonacci 38.2%1.3622
Daily Fibonacci 61.8%1.3634
Daily Pivot Point S11.3594
Daily Pivot Point S21.357
Daily Pivot Point S31.354
Daily Pivot Point R11.3648
Daily Pivot Point R21.3678
Daily Pivot Point R31.3702

Author

Sagar Dua

Sagar Dua

FXStreet

Sagar Dua is associated with the financial markets from his college days. Along with pursuing post-graduation in Commerce in 2014, he started his markets training with chart analysis.

More from Sagar Dua
Share:

Markets move fast. We move first.

Orange Juice Newsletter brings you expert driven insights - not headlines. Every day on your inbox.

By subscribing you agree to our Terms and conditions.

Editor's Picks

EUR/USD holds steady below 1.1800

EUR/USD moves sideways in a narrow channel below 1.1800 as the market volatility remains low ahead of the New Year holiday. On Tuesday, investors will pay close attention to the minutes of the Federal Reserve's December policy meeting.

GBP/USD retreats below 1.3500 as trading conditions remain thin

GBP/USD corrects lower after posting strong gains in the previous week and trades below 1.3500 on Monday. With the action in financial markets turning subdued following the Christmas holiday, however, the pair's losses remain limited.

Gold holds above $4,300 after setting yet another record high

Spot Gold traded as high as $4,550 a troy ounce on Monday, fueled by persistent US Dollar weakness and a dismal mood. The XAU/USD pair was hit sharply by profit-taking during US trading hours and retreated towards $4,300, where buyers reappeared.

Crypto market outlook for 2026

Year 2025 was volatile, as crypto often is.  Among positive catalysts were favourable regulatory changes in the U.S., rise of Digital Asset Treasuries (DAT), adoption of AI and tokenization of Real-World-Assets (RWA).

Economic outlook 2026-2027 in advanced countries: Solidity test

After a year marked by global economic resilience and ending on a note of optimism, 2026 looks promising and could be a year of solid economic performance. In our baseline scenario, we expect most of the supportive factors at work in 2025 to continue to play a role in 2026.

Crypto market outlook for 2026

Year 2025 was volatile, as crypto often is.  Among positive catalysts were favourable regulatory changes in the U.S., rise of Digital Asset Treasuries (DAT), adoption of AI and tokenization of Real-World-Assets (RWA).