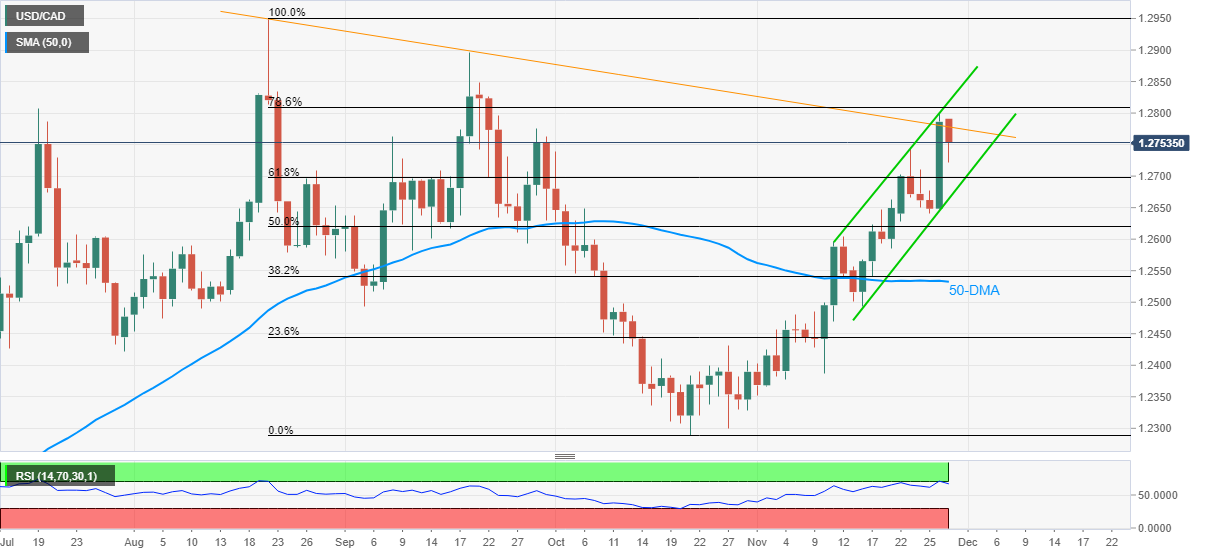
USD/CAD Price Analysis: 1.2810 appears a tough nut to crack for bulls
- USD/CAD reverses pullback from nine-week top, recently picking up bids.
- 78.6% Fibonacci retracement, July’s top and upper line of 12-day-old channel challenge buyers.
- Overbought RSI conditions add to upside filters, bears can rest assured below 50-DMA.
USD/CAD pares intraday losses around 1.2750, down 0.25% on a day as European traders brace for Monday’s bell.
The Loonie pair jumped to the highest levels since late September the previous day but couldn’t cross 78.6% Fibonacci retracement (Fibo.) August-October downside and July’s high surrounding 1.2810. Adding strength to the 1.2810 resistance is the short-term channel’s upper line/
In addition to the failures to cross the key resistance, overbought RSI conditions also challenge the USD/CAD buyers, suggesting smoother roads for the pair’s downside.
That said, the support line of the stated channel, around 1.2660, restricts the short-term downside of the pair, a break of which will highlight 50% Fibo. level of 1.2620.
It should be noted, however, that the USD/CAD weakness past 1.2620 will be challenged by a 50-DMA level of 1.2532.
On the contrary, a daily closing past 1.2810 will aim for September’s high of 1.2900 before August month’s peak of 1.2950 and the 1.3000 psychological magnet lure the pair bulls.
USD/CAD: Daily chart
Trend: Pullback expected
Author

Anil Panchal
FXStreet
Anil Panchal has nearly 15 years of experience in tracking financial markets. With a keen interest in macroeconomics, Anil aptly tracks global news/updates and stays well-informed about the global financial moves and their implications.


