USD/CAD peaks in the 1.3820s after Canadian inflation data misses estimates
- USD/CAD peaks after the release of cooler Canadian inflation data.
- Although headline CPI fell to 1.6% in September BoC CPI Core rose.
- The pair has risen for ten days in a row also due to a strong performance by the US Dollar.

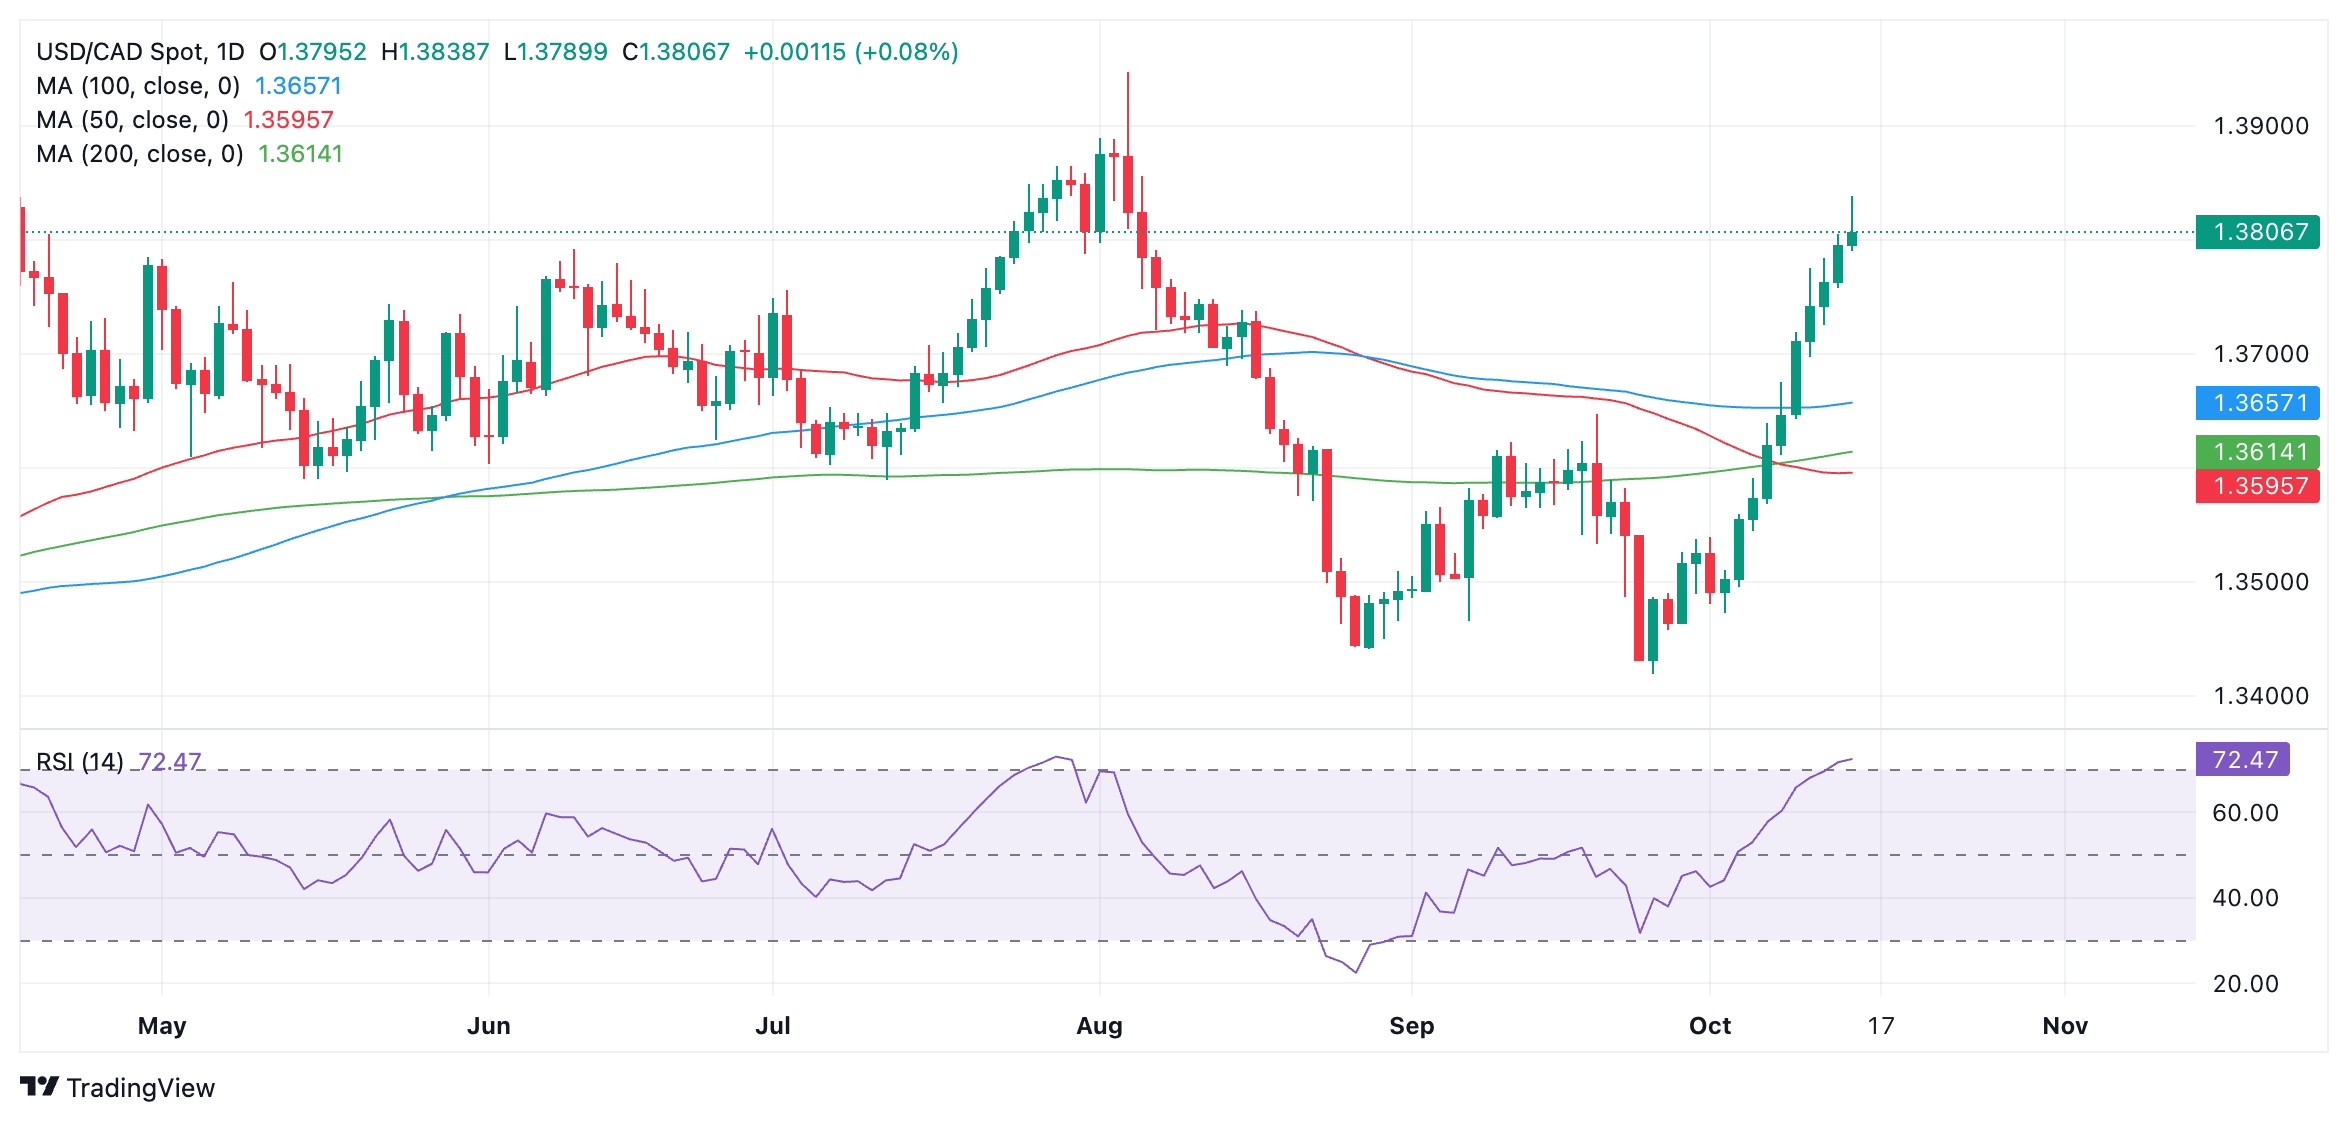
USD/CAD extends its stretch of gains to ten days in a row on Tuesday, clocking up over 2.7% over that period as it peaks at 1.3829. The latest gains come thanks to the Canadian Dollar (CAD) temporarily weakening after the release of lower-than-expected Canadian inflation data. This showed the Consumer Price Index (CPI) declining to 1.6% annually in September, from 2.0% in August, and below estimates of 1.8%.
USD/CAD Daily Chart
Lower inflation suggests the Bank of Canada (BoC) will have to cut interest rates again after already making three consecutive 0.25% reductions, in order to cut excess supply and underpin the labor market. The expectation of lower interest rates, in turn, reduces foreign capital inflows, which reduces demand for the Canadian Dollar.
The fall in inflation was mainly caused by a 10.7% decline in gasoline prices in September, and also affected related sectors such as transportation (down 1.5%). It marks the second month that headline inflation has fallen below the bank’s 2.0% target. The fall in gasoline prices is due to lower Crude Oil prices which is Canada’s largest export commodity. This, in turn, is a backdraught for the pair as lower Oil prices are bearish for CAD.
Whilst it rallied as an initial reaction to the CPI data, USD/CAD quickly reversed and began falling not long after the release, perhaps due to an uptick in BoC CPI Core, or because the pair might be “overbought” – or entering the realms of overvaluation after its stellar rally in October.
USD/CAD has made further gains due to a strengthening US Dollar (USD) as markets reduce bets the US Federal Reserve (Fed) will go ahead with more aggressive rate cuts at its November meeting after kicking off its easing cycle with a “mega” 50 basis points (bps) (0.50%) cut in September.
From market-based chances of 60% for the Fed to follow up with another 50 bps cut in November a series of better-than-expected data releases, especially labor market data, has reassured markets that the US economy is not teetering on the edge of a precipice and led to a dramatic revision of the probabilities to zero. On Tuesday the probability of the Fed cutting by a lesser 25 bps stood at 90% with a 10% chance the Fed would decide not to cut interest rates at all.
Other data on Tuesday showed the BoC Consumer Price Index Core rose 1.6% YoY in September from 1.5% in August. Core prices rose 0.1% MoM the same as in August, according to data from Statistics Canada.
Headline CPI fell 0.4% MoM compared to the 0.2% decline of the previous month.
Author

Joaquin Monfort
FXStreet
Joaquin Monfort is a financial writer and analyst with over 10 years experience writing about financial markets and alt data. He holds a degree in Anthropology from London University and a Diploma in Technical analysis.


