|

USD/CAD facing further downside after rejecting 1.3520

  • USD/CAD seeing mid-Thursday rejection from the topside as Greenback pauses.
  • Oil-based CAD getting bolstered by rebounding oil prices.
  • US PMIs, CAD Retail Sales still in the pipe for Friday.

The USD/CAD lifted in early Thursday trading, clipping into 1.3520 before seeing a clean rejection, and is now trading down into 1.3475 as the Greenback (USD) takes a breather and the Loonie (CAD) finds support from bouncing crude oil prices.

The oil-based Loonie is finding some minor support from crude prices heading into the end of the week, rebounding after the USD caught a firm bid across the board after Thursday's Federal Reserve (Fed) rate call. The Fed stood still on interest rates, but a rising rate outlook firmed up the chances of another rate hike before the end of the year.

On the economic calendar, Friday comes in with CAD Retail Sales and US Purchasing Manager Index (PMI) figures.

CAD retail sales, US PMIs both seen improving

Canadian retail sales from July are forecast to see confirmed month-over-month growth of 0.4%, an uptick from the previous period's 0.1%.

On the US side, PMIs are expected to improve slightly, with the manufacturing component forecast to lift from 47.9 to 48.0, and the services side moving from 50.5 to 50.6.

USD/CAD technical outlook

The USD/CAD has been catching bids ever since the Fed release yesterday, taking the pair up nearly a full percent bottom-to-top, before running aground on the 200-hour Simple Moving Average (SMA) near 1.3520.

The pair is now set to fall further, declining past the 100-hour SMA and looking at the top side of the descending intraday trendline, marked in from 1.3580.

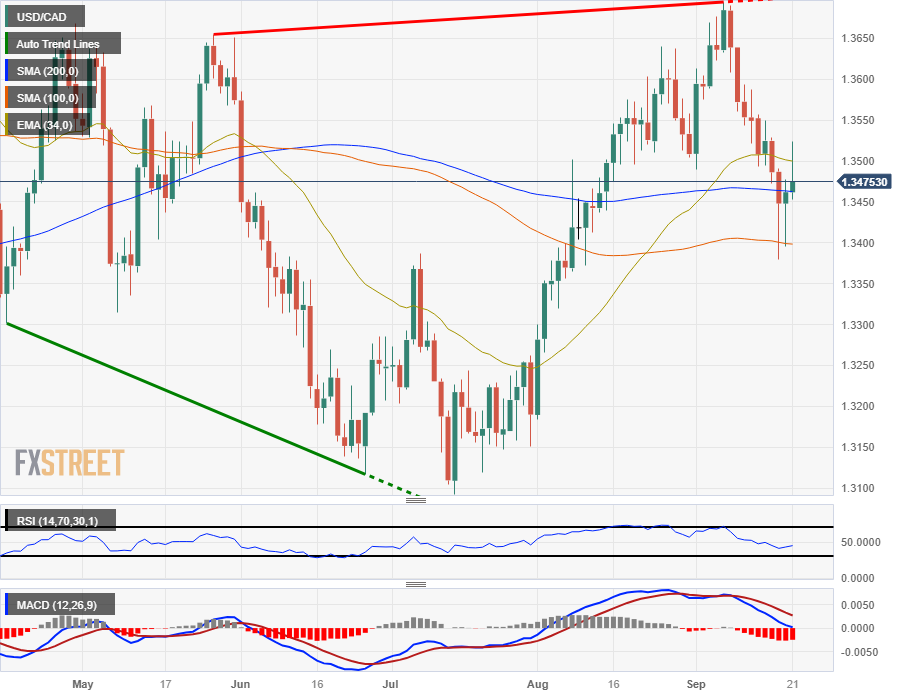
On the daily candlesticks, the USD/CAD is looking for a rebound from the 34-day Exponential Moving Average (EMA) near 1.3400, and is getting hung up on the 200-day SMA close to the current price action.

USD/CAD daily chart
USD/CAD technical levels

USD/CAD

Overview
Today last price1.3477
Today Daily Change0.0015
Today Daily Change %0.11
Today daily open1.3462
 
Trends
Daily SMA201.3563
Daily SMA501.3428
Daily SMA1001.3399
Daily SMA2001.3463
 
Levels
Previous Daily High1.3477
Previous Daily Low1.3396
Previous Weekly High1.3639
Previous Weekly Low1.3493
Previous Monthly High1.364
Previous Monthly Low1.3184
Daily Fibonacci 38.2%1.3446
Daily Fibonacci 61.8%1.3427
Daily Pivot Point S11.3412
Daily Pivot Point S21.3363
Daily Pivot Point S31.3331
Daily Pivot Point R11.3494
Daily Pivot Point R21.3527
Daily Pivot Point R31.3576

Author

Joshua Gibson

Joshua joins the FXStreet team as an Economics and Finance double major from Vancouver Island University with twelve years' experience as an independent trader focusing on technical analysis.


More from Joshua Gibson
Share:

Editor's Picks

GBP/USD clings to multi-day peaks below 1.3500

GBP/USD trades with marked gains on Friday, now giving away some gains following an earlier surpass of the key 1.3500 yardstick. Indeed, Cable gathers fresh steam amid the strong offered stance in the Greenback, all after US NFP badly missed expectations in July.

EUR/USD: Post-NFP bounce falters around 1.1580

EUR/USD reverses Thursday’s decline and trades with solid gains in the 1.1560 region, or two-month peaks, on Friday. The pair’s firm performance comes in a context of a sharp correction in the US Dollar as investors continue to assess disheartening US NFP readings.

How Wall Street rigs the game [Video]

In this week’s Live from the Vault, Andrew Maguire is joined by Peter Antico and Sean Stone to discuss the Paradigm of Money - an in-depth expose of financial market corruption, from naked shorting to the two-tier system that protects Wall Street.

XRP Price Forecast: XRP nears critical $1.00 support
Ripple (XRP) remains pressured on Friday, trading around $1.03 at the time of writing. The token appears to hold this current level as support but lacks a catalyst to sustain a knee-jerk rebound toward the next key resistance at $1.10.
Is Gold about to enter its biggest bull run since 2020?
Gold has stormed back into the spotlight and its next move could leave late buyers chasing. On August 5, the yellow metal surged almost 7% – roughly $174 – to close near $4,308 an ounce, posting one of its biggest daily advances in recent history. A weaker U.S dollar, falling Treasury yields, changing Federal Reserve expectations and renewed safe-haven demand all struck at once.
9-3: Is the Federal Reserve’s vote tally Warsh's new forward guidance?
The rate did not move. Neither did the statement, and that’s the more interesting fact. Set the July 29 Federal Open Market Committee (FOMC) statement beside the one issued on June 17, and the two documents are identical apart from a single verb and a paragraph at the bottom naming three dissenters.













