|

USD/BRL declines near the 200-day SMA, eyes on Argentinian elections

  • USD/BRL saw more than 0.30% losses and fell to monthly lows.
  • Argentinian left-wing Sergio Massa was unexpectedly the highest-voted candidate in the first-round elections from Argentina on Sunday.
  • Brazil will release Mid-month inflation data from October on Thursday.
  • Investors await high-tier economic data from the US to continue modelling their expectations on the Fed.

On Monday, the USD/BRL fell to its lowest level since early September, towards the 5.010 area, down by more than 0.30%. The broad-based USD weakness in FX markets can explain this trajectory and focus is now set on high-tier economic activity figures from the US released this week. 

On the BRL side, mid-month inflation data from October will be closely watched on Thursday. In addition, investors should monitor the Argentinian political situation as it is one of its main trading partners. On Sunday, Sergio Massa, representing the left-wing Union Por La Patria movement, unexpectedly was the front-runner in Argentina’s first-round elections over the favourite Javier Milei from la Libertad Avanza. It is worth noticing that both candidates are on opposite poles economically, and the winner will shape the area's economic landscape, which could affect the BRL price dynamics.

On the USD side, the US will release the S&P Manufacturing PMI from October on Tuesday, followed by the Q3 Gross Domestic Product (GDP) and the Core Personal Consumption Expenditures from September, the Fed’s preferred inflation gauge. All data points will guide investors in modelling their expectations for the next meetings, and in the meantime, markets are confident that the Fed won’t hike again in 2023 and those dovish bets, makes the USD lose interest.

USD/BRL Levels to watch 

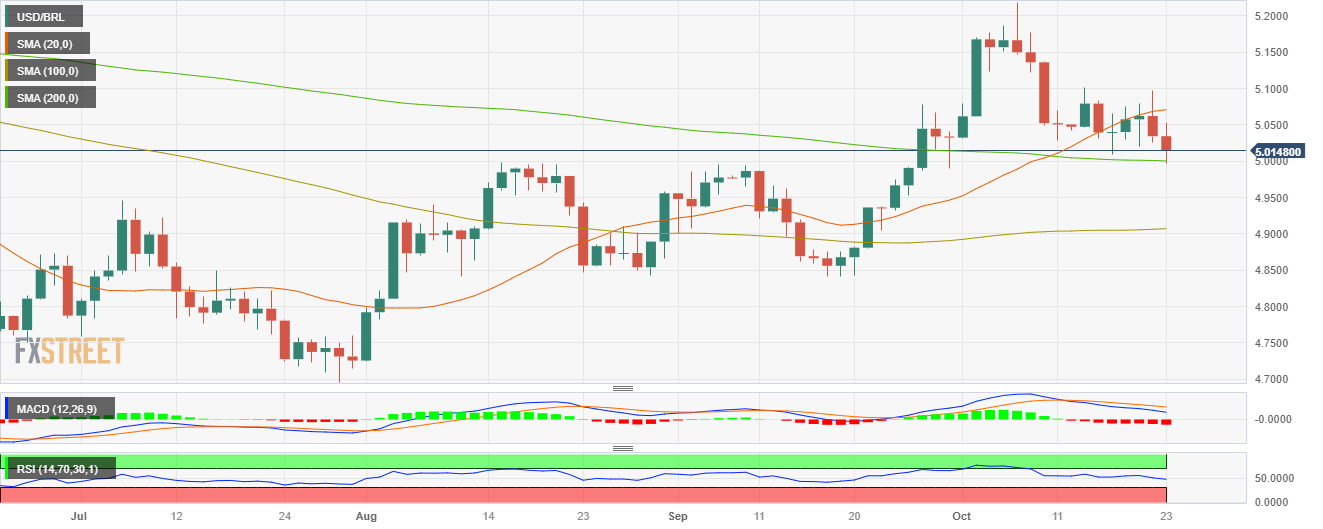
 The technical analysis of the daily chart suggests a neutral to bearish stance for USD/BRL as the bears work on staging a recovery and gaining further ground. The Relative Strength Index (RSI) points south below its middle point, while the Moving Average Convergence (MACD) histogram presents rising red bars. On the other hand, the pair is below the 20-day Simple Moving Average (SMA) but above the 100 and 200-day SMAs, highlighting that on the broader picture, the outlook still favours the bulls.

 Support levels: 5.0000 (200-day SMA), 4.9700, 4.9500.

 Resistance levels: 5.0535, 5.0700 (20-day SMA), 5.0940.

USD/BRL Daily Chart

USD/BRL

Overview
Today last price5.0199
Today Daily Change-0.0146
Today Daily Change %-0.29
Today daily open5.0345
 
Trends
Daily SMA205.0687
Daily SMA504.9834
Daily SMA1004.9064
Daily SMA2005.0011
 
Levels
Previous Daily High5.098
Previous Daily Low5.0255
Previous Weekly High5.098
Previous Weekly Low5.0098
Previous Monthly High5.0784
Previous Monthly Low4.8419
Daily Fibonacci 38.2%5.0532
Daily Fibonacci 61.8%5.0703
Daily Pivot Point S15.0073
Daily Pivot Point S24.9802
Daily Pivot Point S34.9348
Daily Pivot Point R15.0798
Daily Pivot Point R25.1252
Daily Pivot Point R35.1523

Author

Patricio Martín

Patricio is an economist from Argentina passionate about global finance and understanding the daily movements of the markets.

More from Patricio Martín
Share:

Editor's Picks

GBP/USD extends losses toward 1.3200 on persistent USD strength

GBP/USD loses further ground toward 1.3200 in the second half of the day on Tuesday. Political uncertainty in the United Kingdom weighs on the British Pound, alongside weak business PMI data for June. Meanwhile, the US Dollar capitalizes on the risk-off mood and hawkish Fed bets ahead of the US PMI release.

EUR/USD falls to fresh 12-month low below 1.1400

EUR/USD comes under renewed selling pressure in the second half of the day on Tuesda and trades at its lowest level since June 2025 below 1.1400. Mixed PMI data from Germany and the Eurozone makes it difficult for the Euro to find demand, while the risk-averse market atmosphere supports the USD, forcing the pair to stay on the back foot. Traders now await the US PMI data.

Gold drops to nearly two-week low, tests $4,100

Gold (XAU/USD) turns south following Monday's rebound and trades deep in the red near $4,100 on Tuesday. Despite positive signals from US-Iran peace talks, widespread skepticism remains toward a final deal and weighs on the precious metal. In the meantime, the USD gathers strength on hawkish Fed expectations and drags XAU/USD lower.

Dogecoin risks fresh yearly lows as bears tighten grip

Dogecoin (DOGE) remains under pressure, trading below $0.09 after failing to break above a key resistance zone, and losing more than 7% last week. Weakening institutional interest, declining social dominance and a rise in bearish derivatives positioning continue to weigh on DOGE. In addition, deteriorating momentum indicators suggest the meme coin risks a deeper correction.

US S&P Global PMI expected to show steady business growth in June

S&P Global will release the June flash Purchasing Managers' Indices for most major economies, with the United States data scheduled on Tuesday. These surveys of top private-sector executives are seen as an early indicator of the country’s economic health.

Regime change: Inside Kevin Warsh's first move to make the Fed unreadable on purpose

The rate did not move. That was the least interesting thing about Kevin Warsh's first meeting in charge of the Fed. The FOMC held its benchmark at 3.50%-3.75% for the fourth straight meeting, exactly as priced, and then the new chair used his first press conference to dismantle the machinery the market has leaned on for a decade.