US Dollar sees US economic data starting to get distorted
- The US Dollar halts decline and sees the DXY US Dollar Index trade around 0.50% lower.
- China says tariffs need to go first, before talks can start.
- The US Dollar Index remains capped below the 100.00 round level.

The US Dollar Index (DXY), which tracks the performance of the US Dollar (USD) against six major currencies, trades lower, roughly 0.60% on Thursday. The knee-jerk reaction originates from United States (US) President Donald Trump and US Treasury Secretary Scott Bessent. Both individually said that no unilateral offer was made to China from the US to lower tariffs, while Trump said that reciprocal tariffs could be revisited if negotiations are not going the way the Trump administration wants them to go, Bloomberg reports.
On the economic calendar front, Durable Goods is painting a very split picture. The headline Durable Goods number is a whopping 10.4% surge against the previous 0.8% where a 2.0% was expected for March. Though, the caveat comes with the core Durable Goods where cars and transportations are left out, which sinks to 0%, a standstill, against the previous 0.7% and expected 0.2%..
Daily digest market movers: US data is getting muddy
- The Financial Times reports that China has called on the US to “completely cancel all unilateral tariff measures” if it wants trade talks on Thursday just hours before the US opening bell. Previous remarks and statements from the Trump administration on a possible trade deal with China are being labeled as 'fake news' by Beijing.
- The Chicago Fed National Activity Index for March fell into contraction by -0.03, coming from 0.18. that same number got revised up to 0.24 for February.
- The US Durable Goods for March and the Jobless Claims already came out as well:
-
- Headline Durable Goods came in at a whopping 10.4%, beating the expected 2% and far up from 1% previously which got revised down to 0.9%. The Orders without Cars and Transportation fell to 0.0%, missing the 0.2% and far less than the 0.7% advance seen a month earlier.
- Weekly Initial Jobless Claims came in higher at 222,000, beating the estimate of 221,000 and up from 215,000 previously. Continuing Claims fell to 1.841 million, beating the 1.88 million estimate.
- Existing Home Sales data for March is starting to signal issues as sales dropped to 4.02 million units, a big miss from the 4.13 million expected and coming from 4.27 million in February.
- Near 15:00 GMT, the Kansas Fed Manufacturing Activity Index for April is expected. No forecast available with the previous number at 1.
- Equities are in a good mood as geopolitical headlines are less active this Thursday, seeing equities overall be positive up to 1% on the day across Europe and the US.
- The CME FedWatch tool shows the chance of an interest rate cut by the Federal Reserve in May’s meeting stands at 6.1% against a 93.9% probability of no change. The June meeting still has around a 58.7% chance of a rate cut.
- The US 10-year yields trade around 4.32% looking for direction as markets are facing some knee jerk reactions on the Trump comments.
US Dollar Index Technical Analysis: Getting hard to read
The US Dollar Index (DXY) is backing off again after a two-day recovery. It looks like the DXY will start to consolidate, trading in a tight range between 100.00 and 98.00. Traders are likely to be fed up with these constant knee-jerk reactions and could opt to look for other places to put their money, with Gold as the preferred sweet spot.
On the upside, the DXY’s first resistance comes in at 99.58, acting up again as a false break occurred Wednesday and Thursday. Should the US Dollar be able to turn positive again, look for 100.22 with a break back above the 100.00 round level as a bullish signal of their return. A firm recovery would be a return to 101.90.
On the other hand, the 97.73 support is very close and could snap at any moment. Further below, a rather thin technical support comes in at 96.94, before looking at the lower levels of this new price range. These would be at 95.25 and 94.56, meaning fresh lows not seen since 2022.
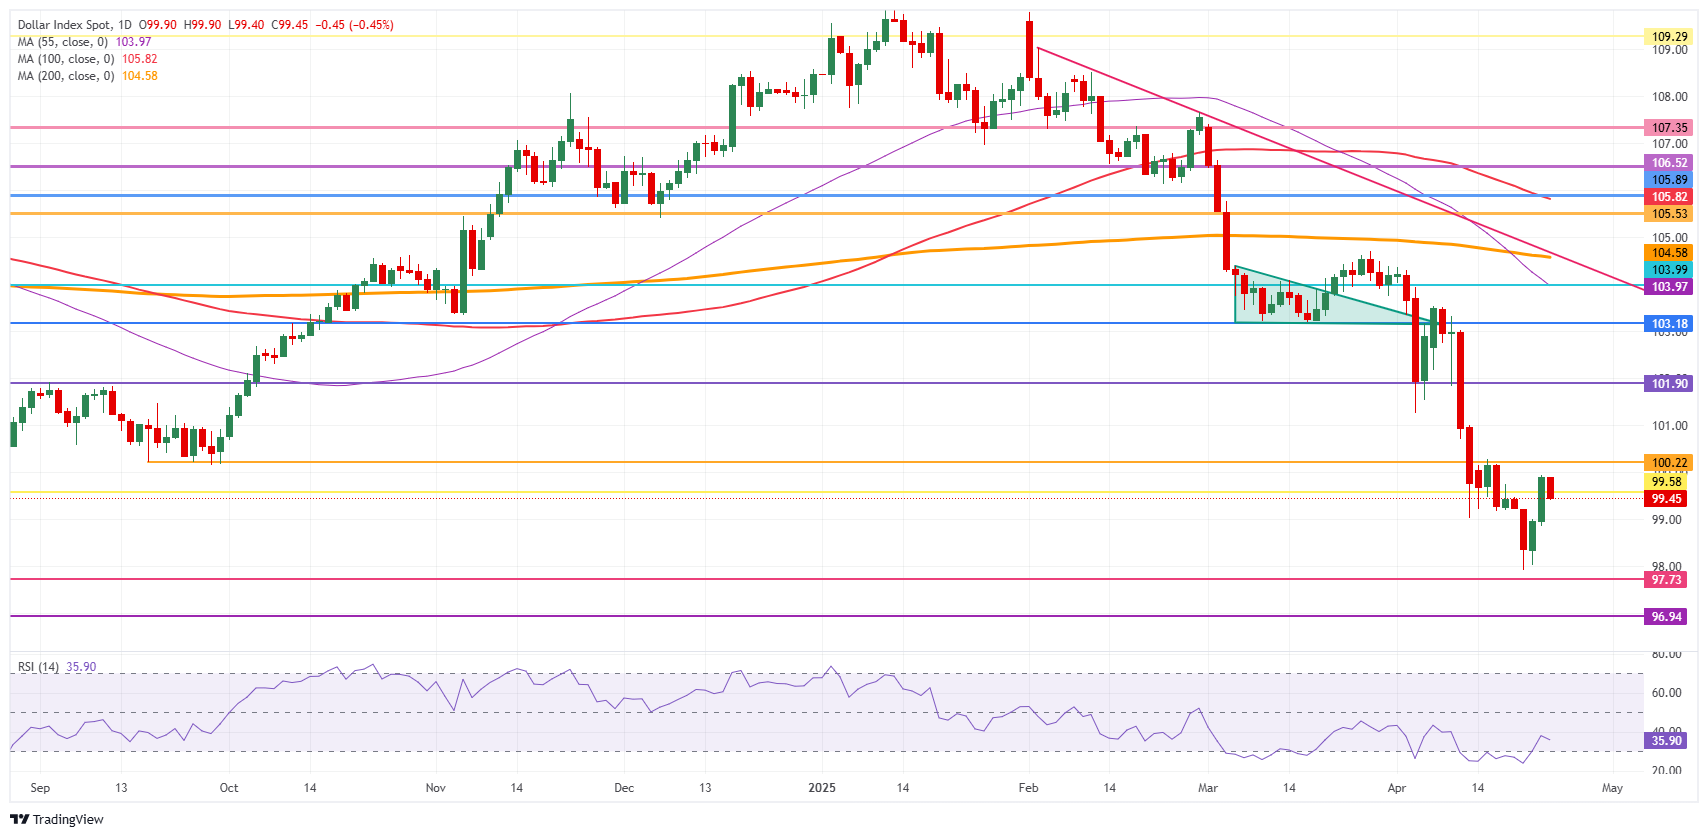
US Dollar Index: Daily Chart
Fed FAQs
Monetary policy in the US is shaped by the Federal Reserve (Fed). The Fed has two mandates: to achieve price stability and foster full employment. Its primary tool to achieve these goals is by adjusting interest rates. When prices are rising too quickly and inflation is above the Fed’s 2% target, it raises interest rates, increasing borrowing costs throughout the economy. This results in a stronger US Dollar (USD) as it makes the US a more attractive place for international investors to park their money. When inflation falls below 2% or the Unemployment Rate is too high, the Fed may lower interest rates to encourage borrowing, which weighs on the Greenback.
The Federal Reserve (Fed) holds eight policy meetings a year, where the Federal Open Market Committee (FOMC) assesses economic conditions and makes monetary policy decisions. The FOMC is attended by twelve Fed officials – the seven members of the Board of Governors, the president of the Federal Reserve Bank of New York, and four of the remaining eleven regional Reserve Bank presidents, who serve one-year terms on a rotating basis.
In extreme situations, the Federal Reserve may resort to a policy named Quantitative Easing (QE). QE is the process by which the Fed substantially increases the flow of credit in a stuck financial system. It is a non-standard policy measure used during crises or when inflation is extremely low. It was the Fed’s weapon of choice during the Great Financial Crisis in 2008. It involves the Fed printing more Dollars and using them to buy high grade bonds from financial institutions. QE usually weakens the US Dollar.
Quantitative tightening (QT) is the reverse process of QE, whereby the Federal Reserve stops buying bonds from financial institutions and does not reinvest the principal from the bonds it holds maturing, to purchase new bonds. It is usually positive for the value of the US Dollar.
BRANDED CONTENT
Finding the right broker for your trading strategy is essential, especially when specific features make all the difference. Explore our selection of top brokers, each offering unique advantages to match your needs.
Author

Filip Lagaart
FXStreet
Filip Lagaart is a former sales/trader with over 15 years of financial markets expertise under its belt.


