US Dollar grinds to a halt after recovering all incurred Monday's losses
- The early Asian decline gets fully pared back with the DXY trading flat near the European close.
- The brief euphoria quickly fades on US tariffs delaying on EU goods.
- The US Dollar Index is back to flat at $99.10.

The US Dollar Index (DXY), which tracks the performance of the Greenback’s value against six major currencies, is trading very close where it opened, near 99.09 at the European closing bell. The dip in the Greenback came after the United States (US) President Donald Trump agreed to extend the deadline of the 50% tariffs on the EU to July 9, instead of June 1, when they were supposed to become effective. Overall, a sigh of relief ripples through markets with risk assets emerging as the biggest winners on these developments at the start of the week.
Several traders and analysts are still pointing to persistent issues that remain sticky. The tax bill from President Trump is on its way to be voted on in the Senate, and will add extra pressure on the US debt. With a further ballooning deficit, yields could still rise more, with traders demanding a higher premium for them to buy US debt.
Daily digest market movers: Chunky week ahead
- Speculative traders remained bearish on the US Dollar but trimmed their positioning to $12.4 billion in the week ending May 20 from $16.5 billion in the week prior, according to CFTC data reported Friday, Reuters reports.
- Trump announced he would extend to July 9 the deadline for the European Union (EU) to face 50% tariffs. The decision came after a call between Trump and European Commission President Ursula von der Leyen on Sunday, and should help the EU negotiate a trade deal with the Trump administration, Bloomberg reports.
- The US economic calendar is almost empty on Monday due to the Memorial Day public holiday in the US. Later this week, the second reading for the US Gross Domestic Product of the first quarter is due on Thursday. The Personal Consumption Expenditure data for April is due Friday.
- Equities are rallying in the brief sigh of relief on the US tariffs delay. European equities are surging over 1%, together with US futures.
- The CME FedWatch tool shows the chances of an interest rate cut by the Federal Reserve in June’s meeting are only at a low 5.6%. Further ahead, the July 30 meeting sees odds for rates being lower than current levels at 23.9%.
- The US 10-year yields will not move this Monday as US markets remain closed due to the Memorial Day public holiday.
US Dollar Index Technical Analysis: Very calm and low volumes
The US Dollar Index recovers from daily lows on Monday, with some adventurous bulls coming in to buy the dip, which materialized in early Asian trading. With the Relative Strength Index (RSI) starting to break below 40 and nearing the oversold barrier, some slowdown and even a turnaround in the DXY could take place. The recovery could be short-lived, though, as several macroeconomic issues are still unresolved.
On the upside, the 100.22 level, which held the DXY back in September-October, is the first resistance, followed by the broken ascending trend line near 100.80 on Monday. Further up, the 55-day Simple Moving Average (SMA) at 101.39 is the next level to watch out for, followed by 101.90, a pivotal level throughout December 2023 and a base for the inverted Head-and-Shoulders (H&S) formation during the summer of 2024. In case US Dollar bulls push the DXY even higher, the 103.18 pivotal level will come into play.
If the downward pressure continues, a nosedive move could materialize towards the year-to-date low of 97.91 and the pivotal level of 97.73. Further below, a relatively thin technical support comes in at 96.94 before looking at the lower levels of this new price range. These would be at 95.25 and 94.56, meaning fresh lows not seen since 2022.
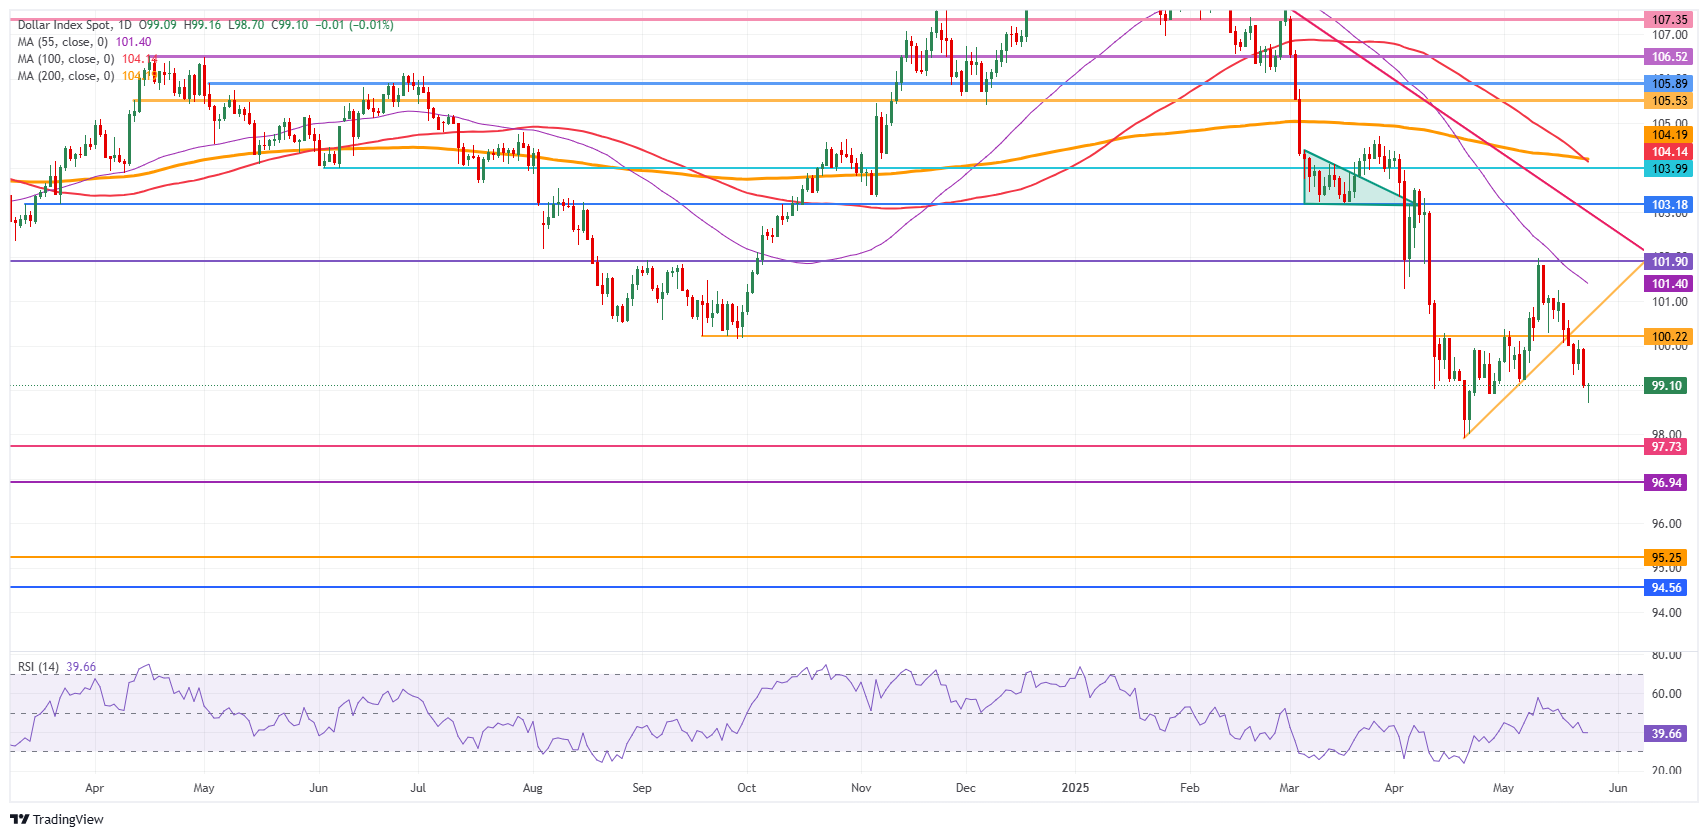
US Dollar Index: Daily Chart
Central banks FAQs
Central Banks have a key mandate which is making sure that there is price stability in a country or region. Economies are constantly facing inflation or deflation when prices for certain goods and services are fluctuating. Constant rising prices for the same goods means inflation, constant lowered prices for the same goods means deflation. It is the task of the central bank to keep the demand in line by tweaking its policy rate. For the biggest central banks like the US Federal Reserve (Fed), the European Central Bank (ECB) or the Bank of England (BoE), the mandate is to keep inflation close to 2%.
A central bank has one important tool at its disposal to get inflation higher or lower, and that is by tweaking its benchmark policy rate, commonly known as interest rate. On pre-communicated moments, the central bank will issue a statement with its policy rate and provide additional reasoning on why it is either remaining or changing (cutting or hiking) it. Local banks will adjust their savings and lending rates accordingly, which in turn will make it either harder or easier for people to earn on their savings or for companies to take out loans and make investments in their businesses. When the central bank hikes interest rates substantially, this is called monetary tightening. When it is cutting its benchmark rate, it is called monetary easing.
A central bank is often politically independent. Members of the central bank policy board are passing through a series of panels and hearings before being appointed to a policy board seat. Each member in that board often has a certain conviction on how the central bank should control inflation and the subsequent monetary policy. Members that want a very loose monetary policy, with low rates and cheap lending, to boost the economy substantially while being content to see inflation slightly above 2%, are called ‘doves’. Members that rather want to see higher rates to reward savings and want to keep a lit on inflation at all time are called ‘hawks’ and will not rest until inflation is at or just below 2%.
Normally, there is a chairman or president who leads each meeting, needs to create a consensus between the hawks or doves and has his or her final say when it would come down to a vote split to avoid a 50-50 tie on whether the current policy should be adjusted. The chairman will deliver speeches which often can be followed live, where the current monetary stance and outlook is being communicated. A central bank will try to push forward its monetary policy without triggering violent swings in rates, equities, or its currency. All members of the central bank will channel their stance toward the markets in advance of a policy meeting event. A few days before a policy meeting takes place until the new policy has been communicated, members are forbidden to talk publicly. This is called the blackout period.
Author

Filip Lagaart
FXStreet
Filip Lagaart is a former sales/trader with over 15 years of financial markets expertise under its belt.


