|

US Dollar Index wavers around 105.00 as the market awaits Fed’s decision

  • DXY retreats 0.25% to 105.06, marking consecutive days of losses, as falling US Treasury yields and risk-on sentiment weigh on the greenback.
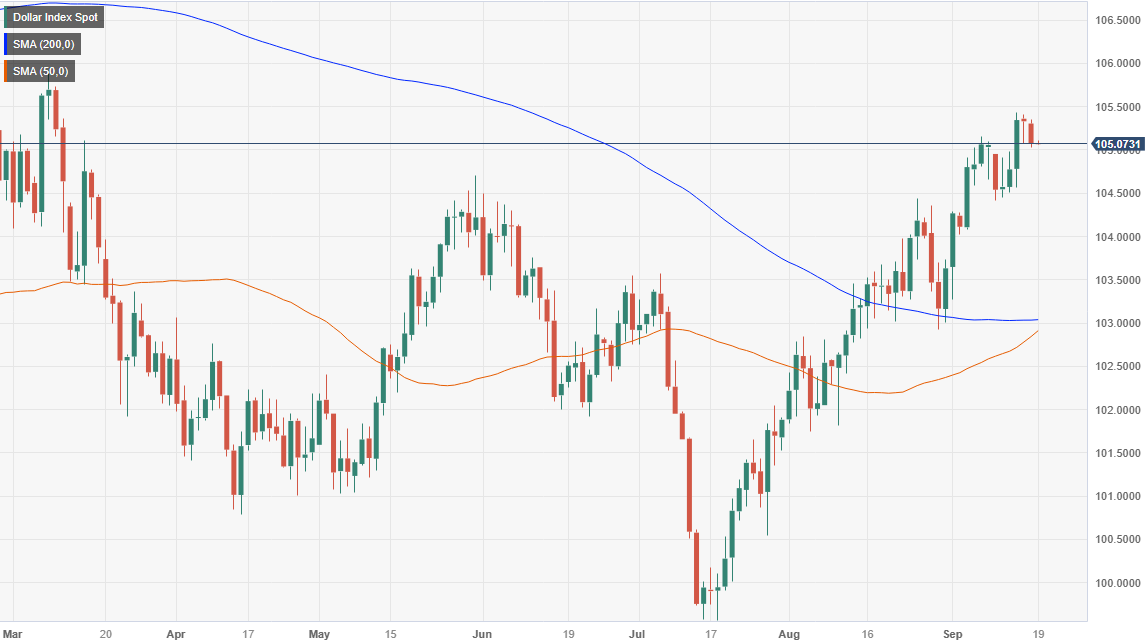
  • Technical indicators point to a golden cross, with the 50-day and 200-day Moving Averages nearing convergence.
  • A hawkish hold from the Fed could propel the DXY towards March highs, while a dovish tone may send it tumbling to key support levels.

The US Dollar Index (DXY), a basket of six currencies that trades against the US Dollar, retreats a minuscule 0.25%, sponsored on a risk-on impulse and falling US Treasury bond yields, ahead of the Federal Reserve’s September meeting. Hence, the DXY is trading at 105.06, printing back-to-back days of losses.

From a technical perspective, the DXY is about to achieve a golden cross, with the 50-day Moving Average (DMA) closing into the 200-DMA, each at 102.83 and 103.02, respectively. In addition, the DXY reached a new five-month high at 105.43, breaking the previous resistance, so the trend is up from a market structure perspective.

If the Fed delivers a hawkish hold, the DXY could test the March 8 swing high at 105.88, followed by the 106.00 threshold. A breach of the latter could expose the November 30 daily high at 107.19

Conversely, the DXY first support would be the 105.00 mark. If sellers reclaim that level, the next support would be a three-month-old upslope support trendline at around 104.40/60, followed by the 104.00 figure.

US Dollar Index Price Action – Daily chart

US Dollar Index: Technical levels

Dollar Index Spot

Overview
Today last price105.07
Today Daily Change-0.26
Today Daily Change %-0.25
Today daily open105.33
 
Trends
Daily SMA20104.27
Daily SMA50102.78
Daily SMA100102.86
Daily SMA200103.03
 
Levels
Previous Daily High105.41
Previous Daily Low105.08
Previous Weekly High105.44
Previous Weekly Low104.42
Previous Monthly High104.44
Previous Monthly Low101.74
Daily Fibonacci 38.2%105.21
Daily Fibonacci 61.8%105.29
Daily Pivot Point S1105.14
Daily Pivot Point S2104.94
Daily Pivot Point S3104.8
Daily Pivot Point R1105.47
Daily Pivot Point R2105.61
Daily Pivot Point R3105.8

Author

Christian Borjon Valencia

Christian Borjon began his career as a retail trader in 2010, mainly focused on technical analysis and strategies around it. He started as a swing trader, as he used to work in another industry unrelated to the financial markets.

More from Christian Borjon Valencia
Share:

Markets move fast. We move first.

Orange Juice Newsletter brings you expert driven insights - not headlines. Every day on your inbox.

By subscribing you agree to our Terms and conditions.

Editor's Picks

EUR/USD bounces toward 1.1750 as US Dollar loses strength

EUR/USD returned to the 1.1750 price zone in the American session on Friday, despite falling Wall Street, which indicates risk aversion. Trading conditions remain thin following the New Year holiday and ahead of the weekend, with the focus shifting to US employment and European data scheduled for next week.

GBP/USD nears 1.3500, holds within familiar levels

After testing 1.3400 on the last day of 2025, GBP/USD managed to stage a rebound. Nevertheless, the pair finds it difficult to gather momentum and trades with modest intraday gains at around 1.3490 as market participants remain in holiday mood.

Gold trims intraday gains, approaches $4,300

Gold retreated sharply from the $4,400  area and trades flat for the day in the $4,320 price zone. Choppy trading conditions exacerbated the intraday decline, although XAU/USD bearish case is out of the picture, considering growing expectations for a dovish Fed and persistent geopolitical tensions.

Cardano gains early New Year momentum, bulls target falling wedge breakout

Cardano kicks off the New Year on a positive note and is extending gains, trading above $0.36 at the time of writing on Friday. Improving on-chain and derivatives data point to growing bullish interest, while the technical outlook keeps an upside breakout in focus.

Economic outlook 2026-2027 in advanced countries: Solidity test

After a year marked by global economic resilience and ending on a note of optimism, 2026 looks promising and could be a year of solid economic performance. In our baseline scenario, we expect most of the supportive factors at work in 2025 to continue to play a role in 2026.

Crypto market outlook for 2026

Year 2025 was volatile, as crypto often is.  Among positive catalysts were favourable regulatory changes in the U.S., rise of Digital Asset Treasuries (DAT), adoption of AI and tokenization of Real-World-Assets (RWA).