|

US Dollar Index technical analysis: The Greenback is settling near the 98.10 level

  • DXY (US Dollar Index) clings to daily gains as the Euro gets slammed by ECB’s Olli Rehn.
  • The next bull targets on the way up can be located at 98.10 and the 98.38 levels.
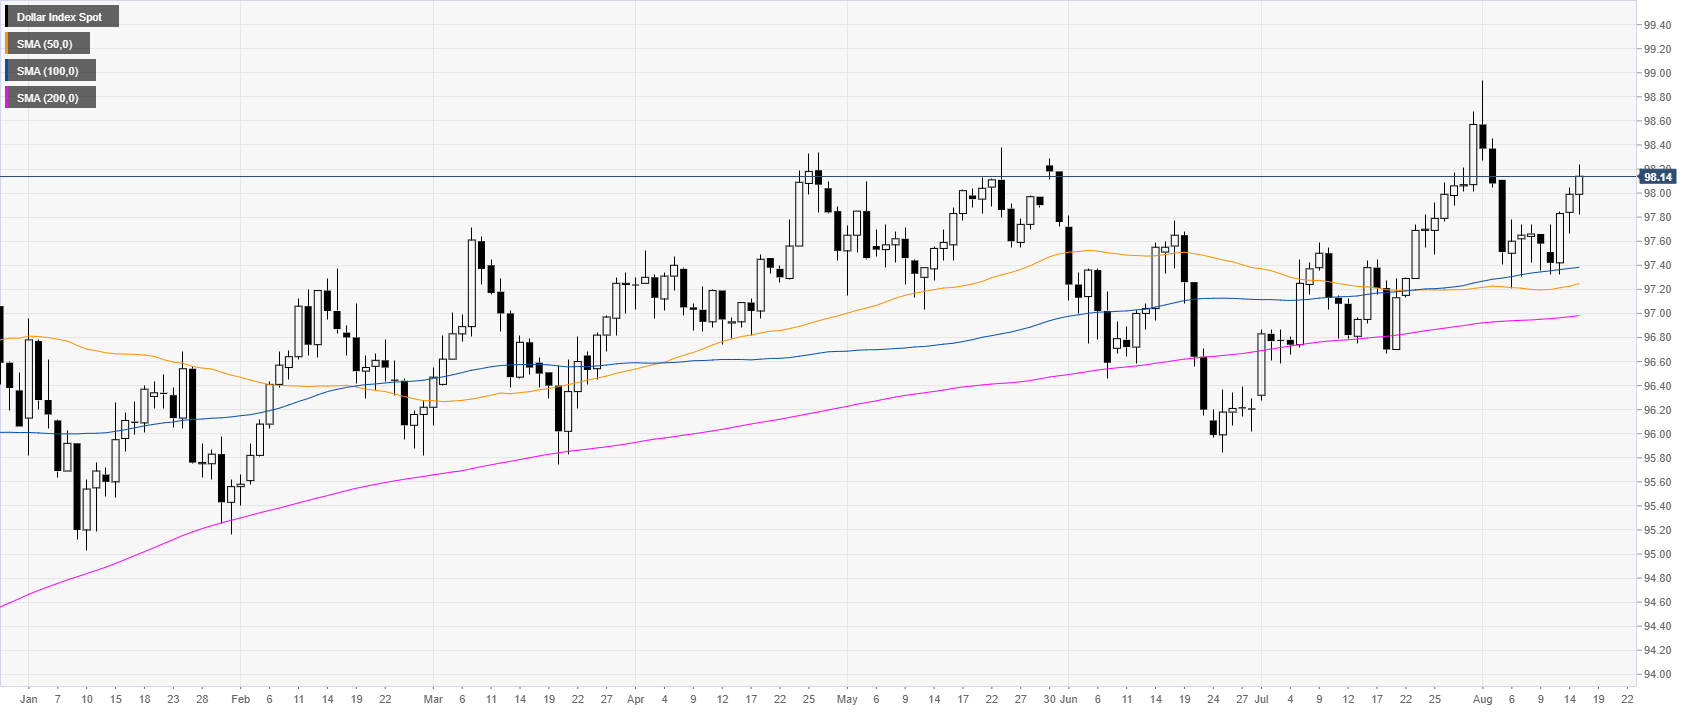
 

DXY daily chart

 
DXY (US Dollar Index) is evolving in a bull trend above its main daily simple moving averages (DSMAs). DXY got a boost as the European Central Bank’s (ECB) member Olli Rehn said that ECB stimulus package in September may beat expectations. Earlier in the early part of the New York session, the Retail Sales Control Group in July surpassed expectations adding to the positive sentiment on the Greenback.
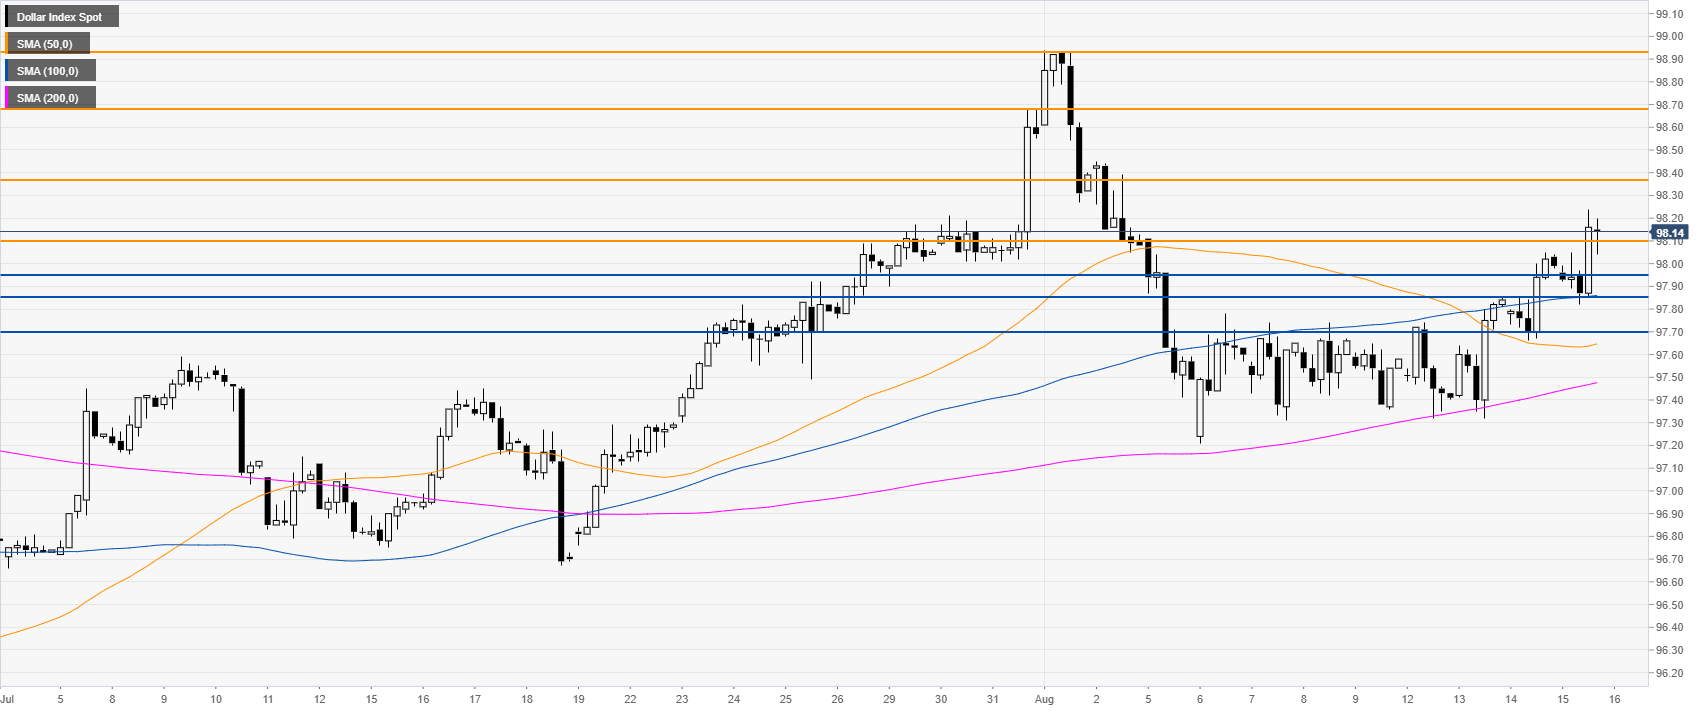
 

DXY 4-hour chart

 
The market is settling above the 98.10 level while above its main SMAs. DXY bulls could drive the market towards the 98.38 resistance, before a potential run to the 98.68 and the 98.93 levels. 
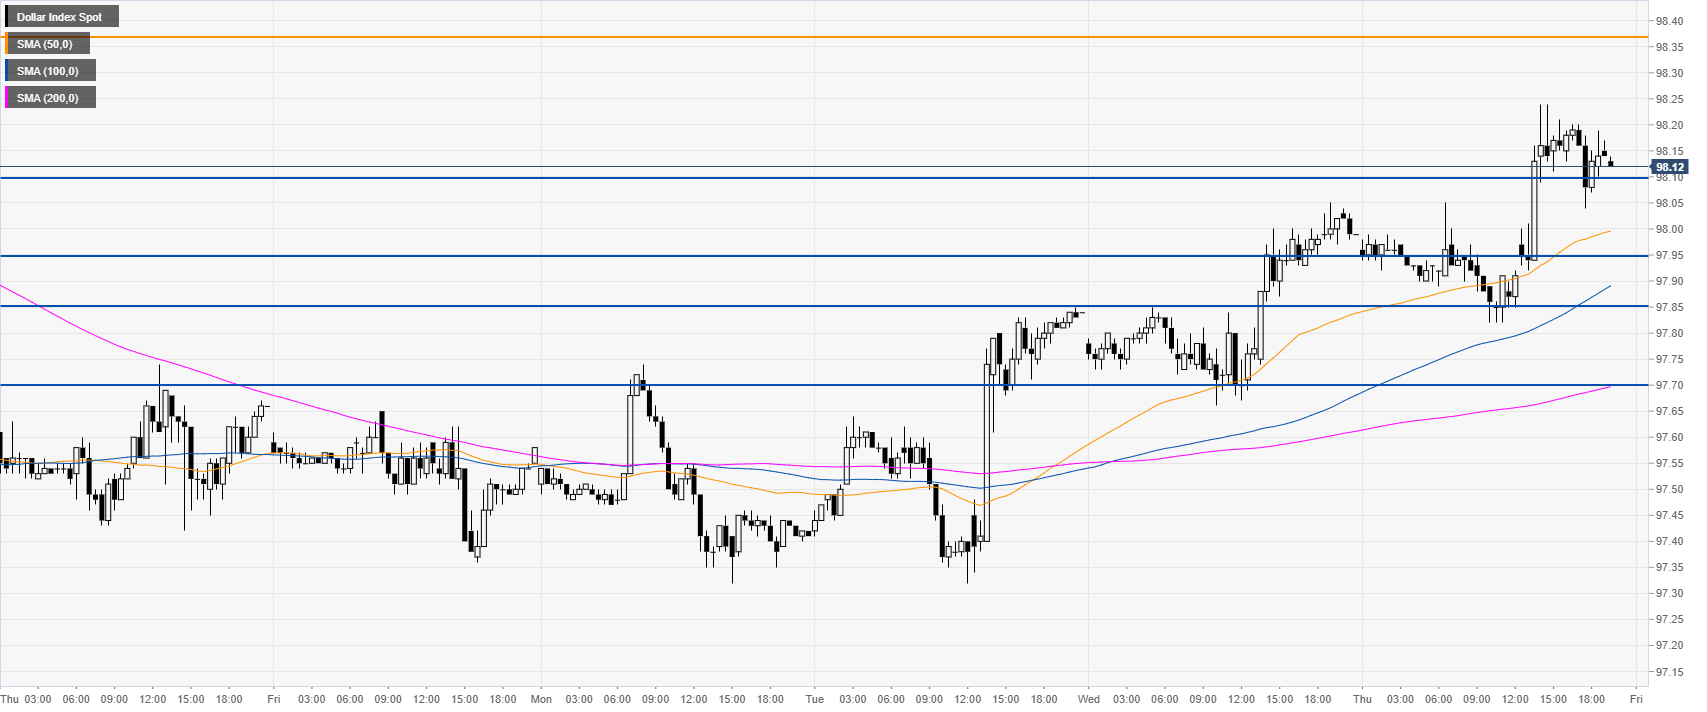
 

DXY 30-minute chart

 
The buying pressure is keeping the Greenback near daily highs. Immediate support could be found near the 98.10, 97.95 and 97.85 levels.
 

Additional key levels

Dollar Index Spot

Overview
Today last price98.14
Today Daily Change0.15
Today Daily Change %0.15
Today daily open97.99
 
Trends
Daily SMA2097.73
Daily SMA5097.23
Daily SMA10097.37
Daily SMA20096.97
Levels
Previous Daily High98.05
Previous Daily Low97.66
Previous Weekly High98.11
Previous Weekly Low97.21
Previous Monthly High98.68
Previous Monthly Low96.28
Daily Fibonacci 38.2%97.9
Daily Fibonacci 61.8%97.81
Daily Pivot Point S197.75
Daily Pivot Point S297.51
Daily Pivot Point S397.36
Daily Pivot Point R198.14
Daily Pivot Point R298.29
Daily Pivot Point R398.53

Author

Flavio Tosti

Flavio Tosti

Independent Analyst


More from Flavio Tosti
Share:

Editor's Picks

EUR/USD: Bears retain control below 1.1780-1.1770 confluence breakpoint

The EUR/USD pair remains on the back foot through the Asian session on Friday and currently trades just above mid-1.1700s, well within striking distance of a nearly one-month low set the previous day.

GBP/USD seems vulnerable near one-month low as traders await US data

The GBP/USD pair prolongs its weekly downtrend for the fifth consecutive day on Friday and slides back closer to a nearly one-month low, touched the previous day. Spot prices trade below mid-1.3400s during the Asian session on Friday and seem vulnerable to slide further as traders now look to important US macro data for a fresh impetus.

Gold eyes next breakout on US GDP, PCE inflation data

Gold sticks to recent gains around the $5,000-mark early Friday, biding time before the high-impact US macro events. The focus is now on the US fourth-quarter Gross Domestic Product, core Personal Consumption Expenditures Price Index and the Supreme Court’s ruling on President Donald Trump’s tariffs.

Bitcoin, Ethereum and Ripple remain range-bound as breakdown risks rise

Bitcoin, Ethereum, and Ripple are trading sideways within consolidation ranges on Friday, signaling a lack of directional bias in the broader crypto market. BTC rebounded from key support, and ETH is nearing the lower consolidation boundary, while XRP is holding at its lower trendline boundary. 

Hawkish Fed minutes and a market finding its footing

It was green across the board for US Stock market indexes at the close on Wednesday, with most S&P 500 names ending higher, adding 38 points (0.6%) to 6,881 overall. At the GICS sector level, energy led gains, followed by technology and consumer discretionary, while utilities and real estate posted the largest losses.

Official Trump price approaches breakout with mixed signals from traders

Official Trump (TRUMP) is trading at $3.50 at the time of writing, approaching its upper consolidation range. A breakout from this range could open the door for an upside move. On-chain data shows market indecision, with balanced flows between bulls and bears, signaling a lack of clear directional bias.