USD/JPY Technical Analysis: Solid 370-pip recovery from the flash crash as 109.70 is on the cards

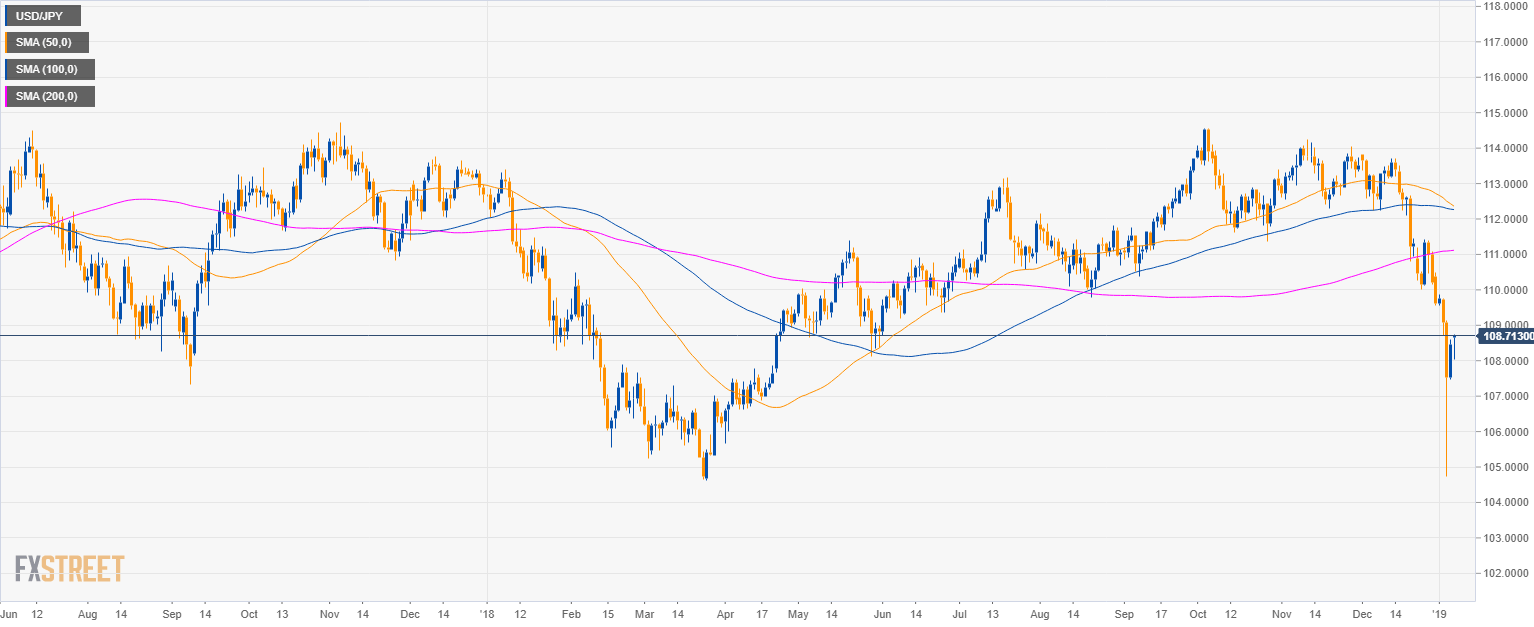
USD/JPY daily chart
- USD/JPY is having a deep pullback below the 50, 100 and 200-period simple moving averages (SMAs).
- USD/JPY recovered 370 pips from the flash crash last week.
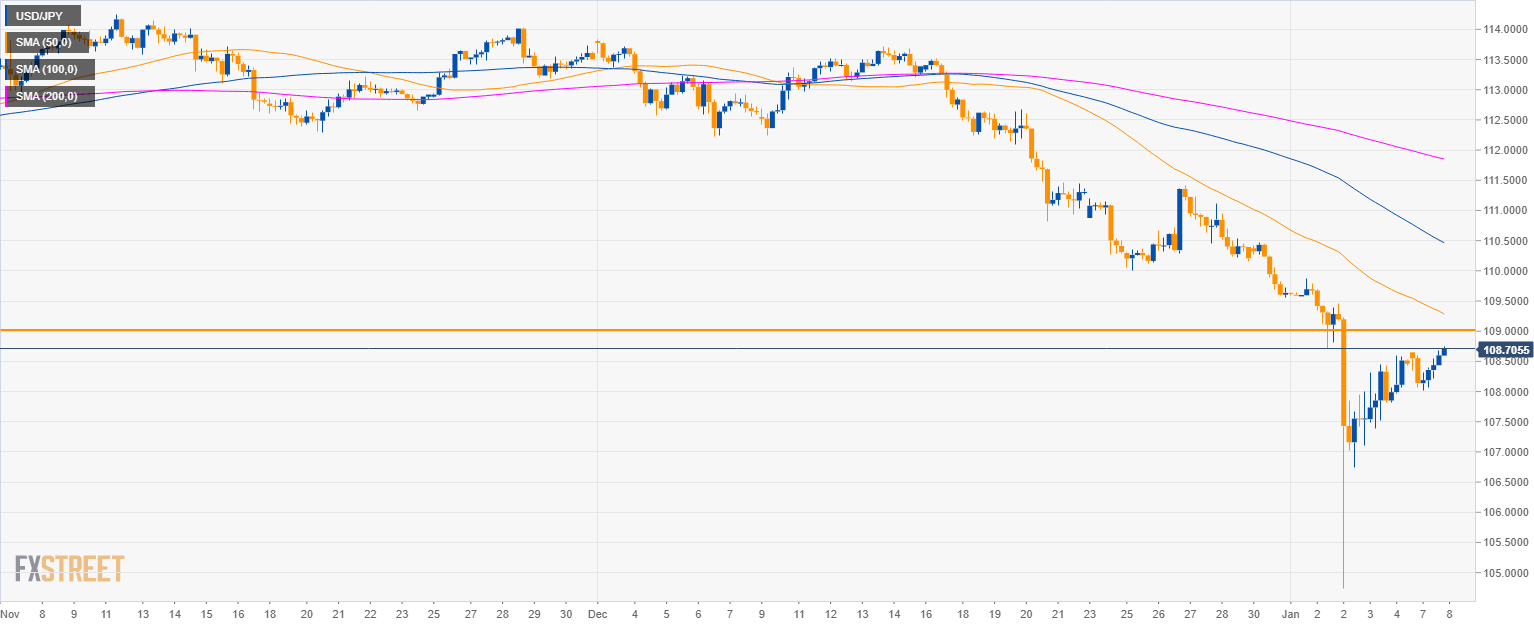
USD/JPY 4-hour chart
- The 109.00 figure is likely going to be the next level to beat for bulls and the one to defend for bears.
- USD/JPY is trading below its main SMAs suggesting that bears have still the medium-term momentum on their side.
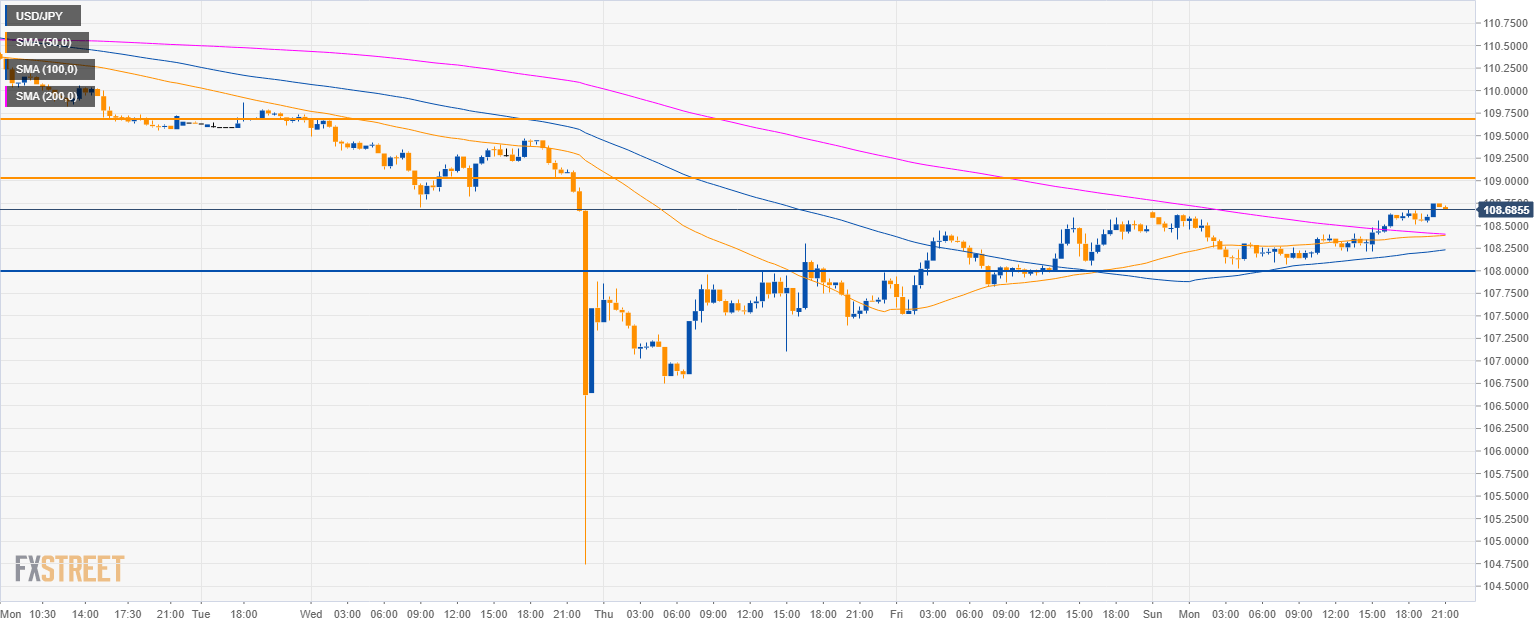
USD/JPY 30-minute chart
- USD/JPY bulls reclaimed the main SMAs as the next bullish objectives become 109.00 and 109.70.
- To the downside, 108.00 figure is likely going to hold as support.
Additional key levels
USD/JPY
Overview:
Today Last Price: 108.71
Today Daily change: 25 pips
Today Daily change %: 0.230%
Today Daily Open: 108.46
Trends:
Previous Daily SMA20: 111.24
Previous Daily SMA50: 112.44
Previous Daily SMA100: 112.28
Previous Daily SMA200: 111.1
Levels:
Previous Daily High: 108.6
Previous Daily Low: 107.47
Previous Weekly High: 110.48
Previous Weekly Low: 104.75
Previous Monthly High: 113.83
Previous Monthly Low: 109.55
Previous Daily Fibonacci 38.2%: 108.16
Previous Daily Fibonacci 61.8%: 107.9
Previous Daily Pivot Point S1: 107.75
Previous Daily Pivot Point S2: 107.04
Previous Daily Pivot Point S3: 106.62
Previous Daily Pivot Point R1: 108.88
Previous Daily Pivot Point R2: 109.3
Previous Daily Pivot Point R3: 110.01
Author

Flavio Tosti
Independent Analyst


