|

US Dollar Index technical analysis: Greenback is creeping up as DXY ends the week on its high near 98.00 figure

  • DXY gained ground on Friday on the back of positive US data. The Michigan Consumer Index for April came in better-than-expected at 102.4 vs. 97.5 forecast.
  • DXY is now quite close to the 2019 high at 98.34.
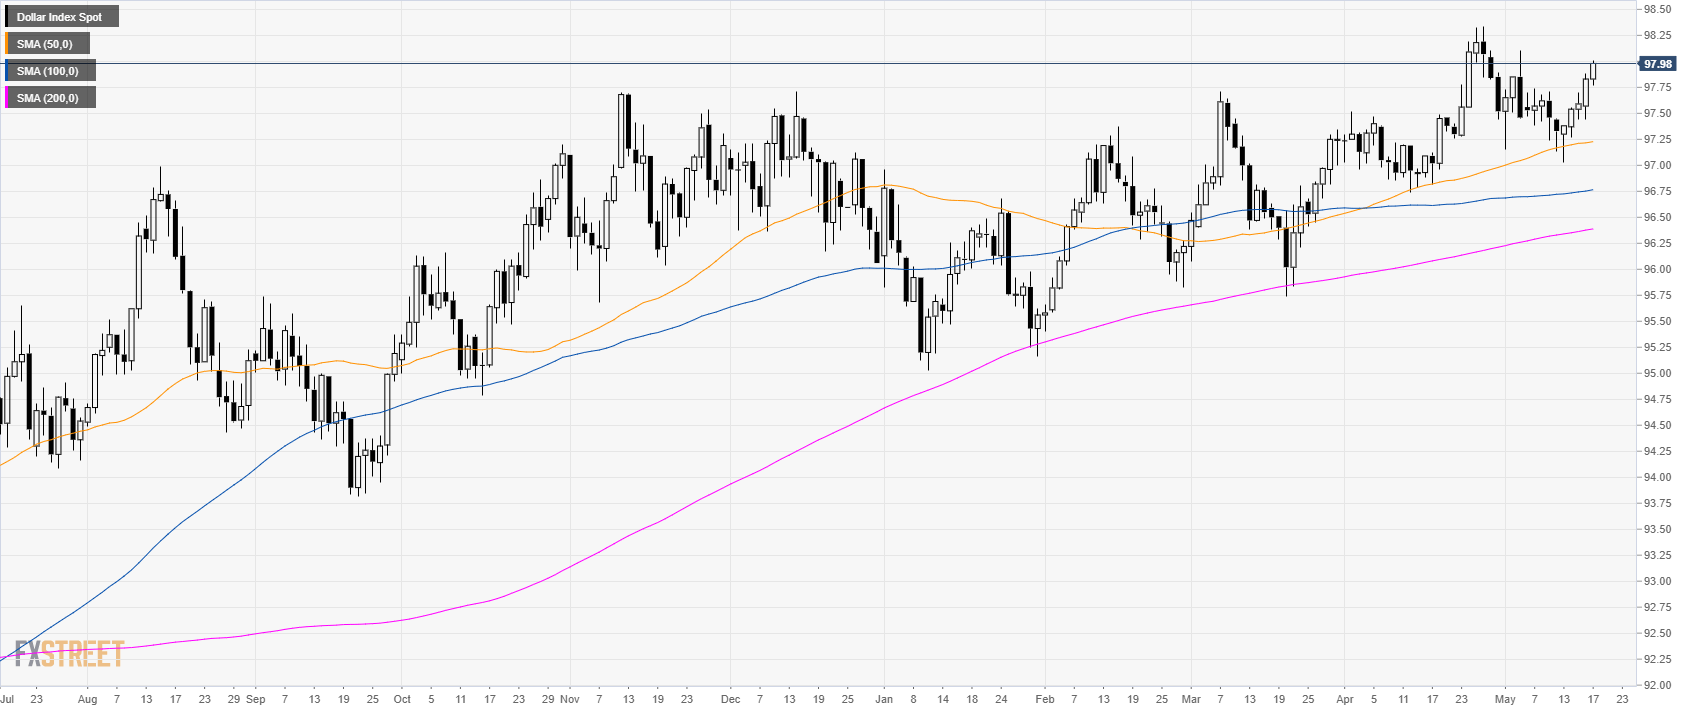
DXY daily chart

The US Dollar Index (DXY) is trading in a bull trend above its main simple moving averages (SMAs).
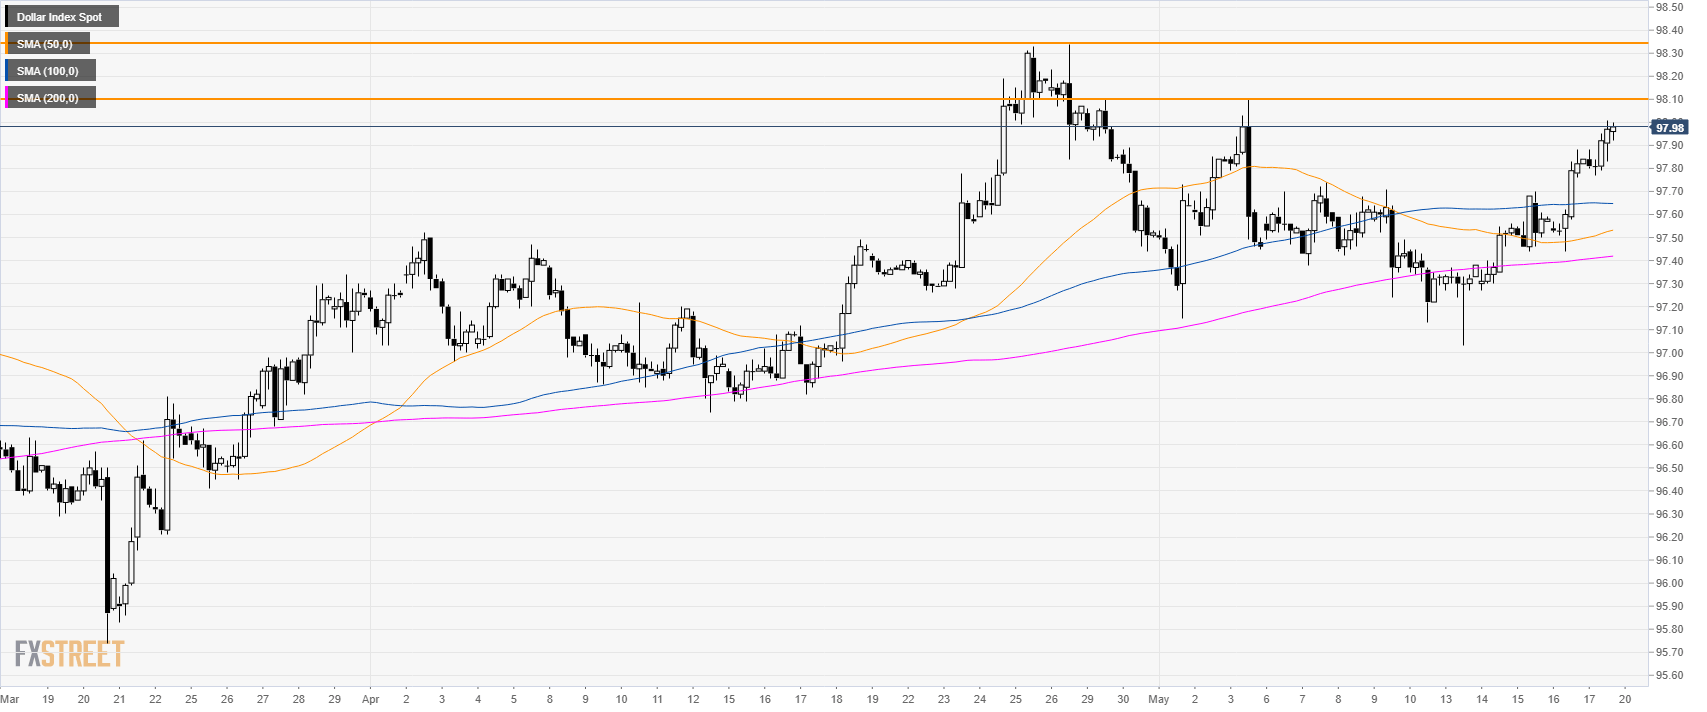
DXY 4-hour chart

The market is trading above its main SMAs suggesting bullish momentum in the near term. The 98.10 and the 98.34 resistance remain the main targets to the upside.
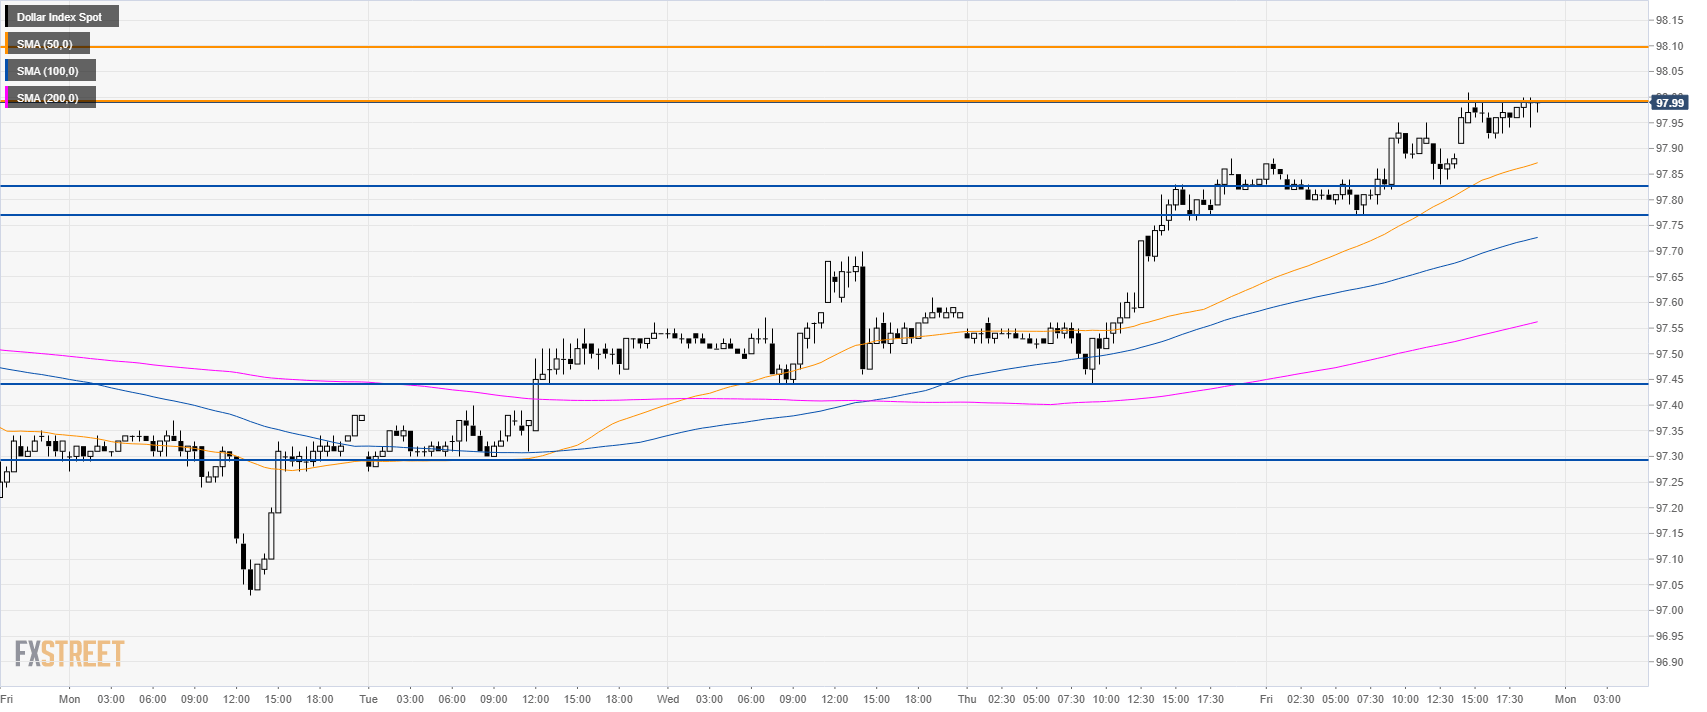
DXY 30-minute chart

The buck is trading above its main SMAs suggesting a bullish bias in the near term. The market is creeping higher as the bulls will try to break above the 98.00 figure next week. A break above the level should open the doors to 98.10 and 98.34, the 2019 high. Immediate support is seen at 98.83 and 98.77 followed by 97.44, Thursday’s low.


Additional key levels

Dollar Index Spot

Overview
Today last price97.98
Today Daily Change0.15
Today Daily Change %0.15
Today daily open97.83
 
Trends
Daily SMA2097.64
Daily SMA5097.22
Daily SMA10096.75
Daily SMA20096.38
Levels
Previous Daily High97.88
Previous Daily Low97.44
Previous Weekly High97.74
Previous Weekly Low97.13
Previous Monthly High98.34
Previous Monthly Low96.74
Daily Fibonacci 38.2%97.71
Daily Fibonacci 61.8%97.61
Daily Pivot Point S197.55
Daily Pivot Point S297.28
Daily Pivot Point S397.11
Daily Pivot Point R197.99
Daily Pivot Point R298.16
Daily Pivot Point R398.43

Author

Flavio Tosti

Flavio Tosti

Independent Analyst


More from Flavio Tosti
Share:

Editor's Picks

EUR/USD flirts with weekly lows near 1.1770

EUR/USD now comes under further selling pressure, breaking below the 1.1800 support to challenge the area of weekly throughs near 1.1770 on Thursday. The pair’s decline comes in response to marked gains in the US Dollar amid steady geopolitical tensions. Ealier in the day, the ECB’s Lagarde delivered cautious remarks, although the currency remained apathetic.

GBP/USD threatens the 200-day SMA near 1.3440

GBP/USD rapidly leaves behind Wednesday’s strong advance, coming under heavy pressure and retesting the 1.3440 zone, where the critical 200-day SMA is located. Cable’s deep pullback follows the strong gains in the Greenback, while investors continue to pencil in a potential BoE rate cut in March.

Gold trims gains, slips back to around $5,170

Gold is now facing some downside pressure, hovering around the $5,170 region on Thursday. The yellow metal surrenders part of its earlier gains on the back of the resurgence of the buying interest in the Greenback. In the meantime, geopolitical tensions in the Middle East continue to limit the downside potential for now.

Stellar: Relief bounce fades as bearish undertone persists

Stellar is trading around $0.16 at the time of writing on Thursday after rebounding more than 8% in the previous day. Derivatives data paints a negative picture as XLM’s short bets hit a monthly high while Open Interest continues to decline.

Changing the game: International implications of recent tariff developments

The Supreme Court ruling on International Emergency Economic Powers Act (IEEPA) tariffs provides limited relief for the rest of the world, with weighted average tariff rates modestly lower.

Bitcoin steadies as traders eye US–Iran talks

Bitcoin (BTC) price is stabilizing around $68,000 at the time of writing on Thursday after a 6.2% relief rally the previous day amid a broader downward trend.