|

US Dollar Index technical analysis: DXY rises to the 97.00 handle

  • DXY is picking up some steam this Wednesday.
  • The level to beat for bulls is 97.00. 
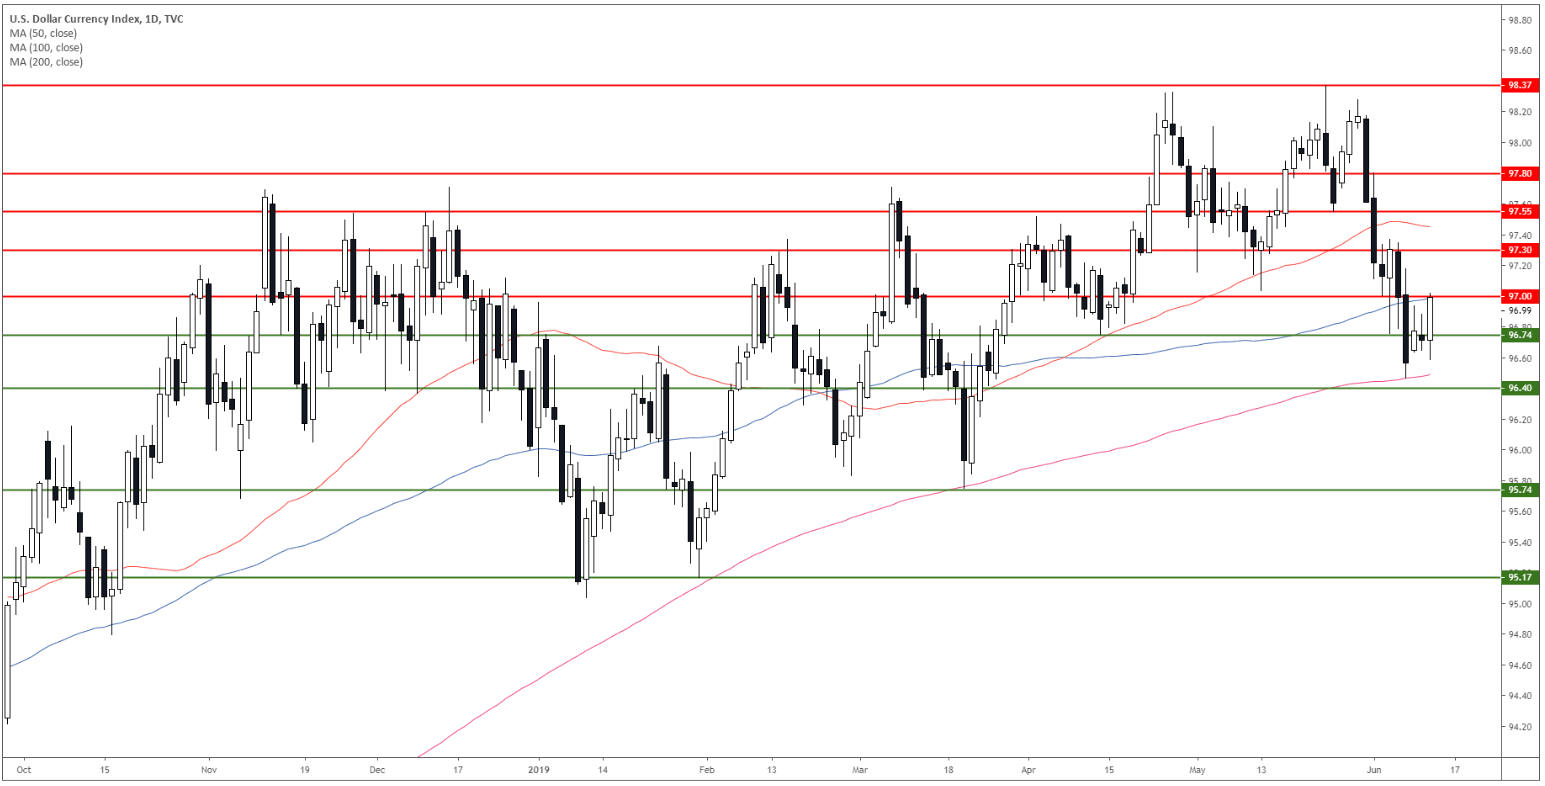
DXY daily chart

The US Dollar Index (DXY) is in a bull trend above the 96.74 support and the 200-day simple moving averages (DSMA). The market is testing the 100 SMA and 97.00 figure.
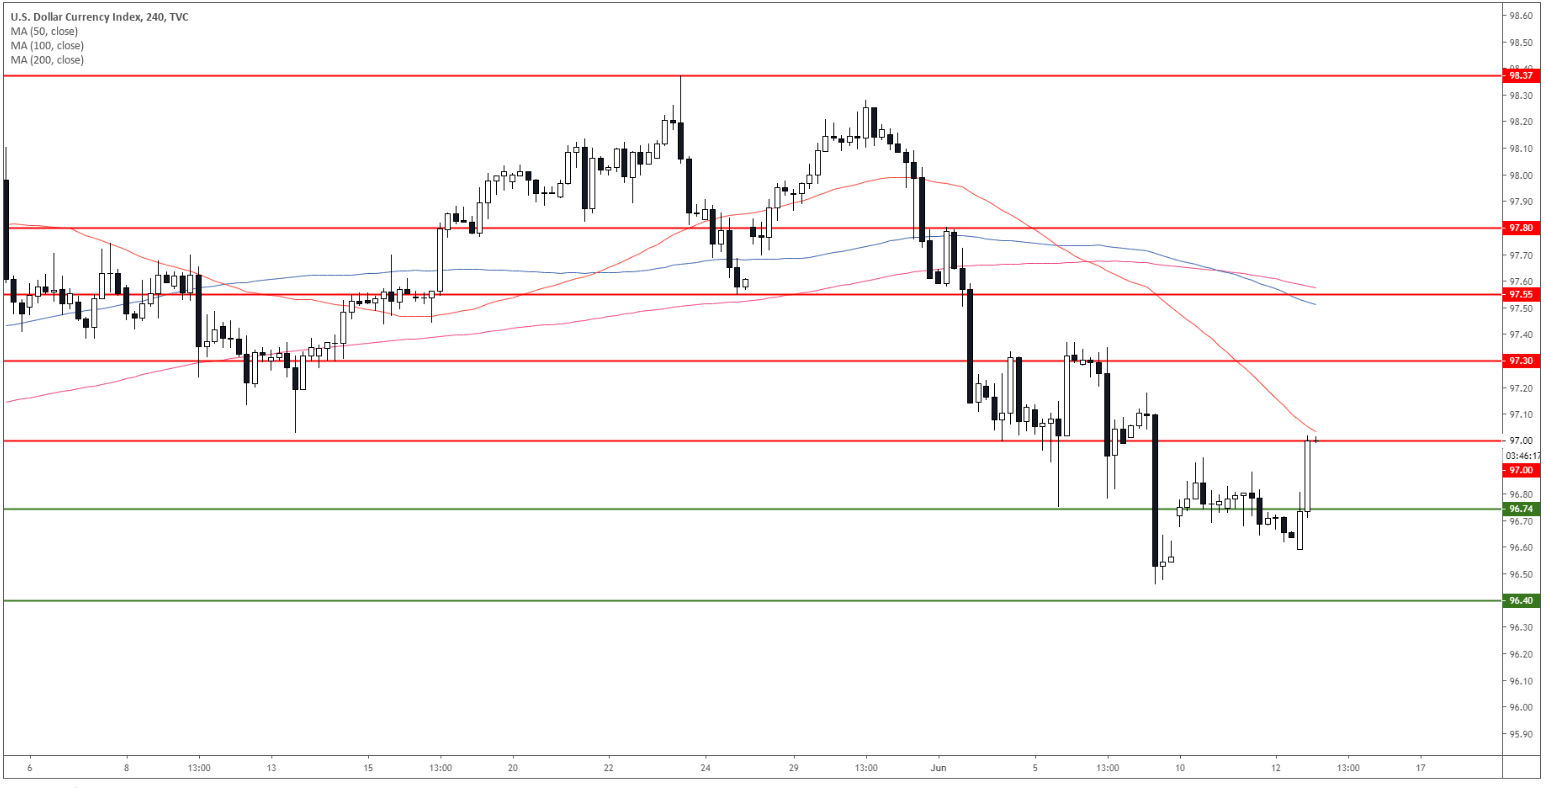

DXY 4-hour chart

DXY is testing the 50 SMA. 
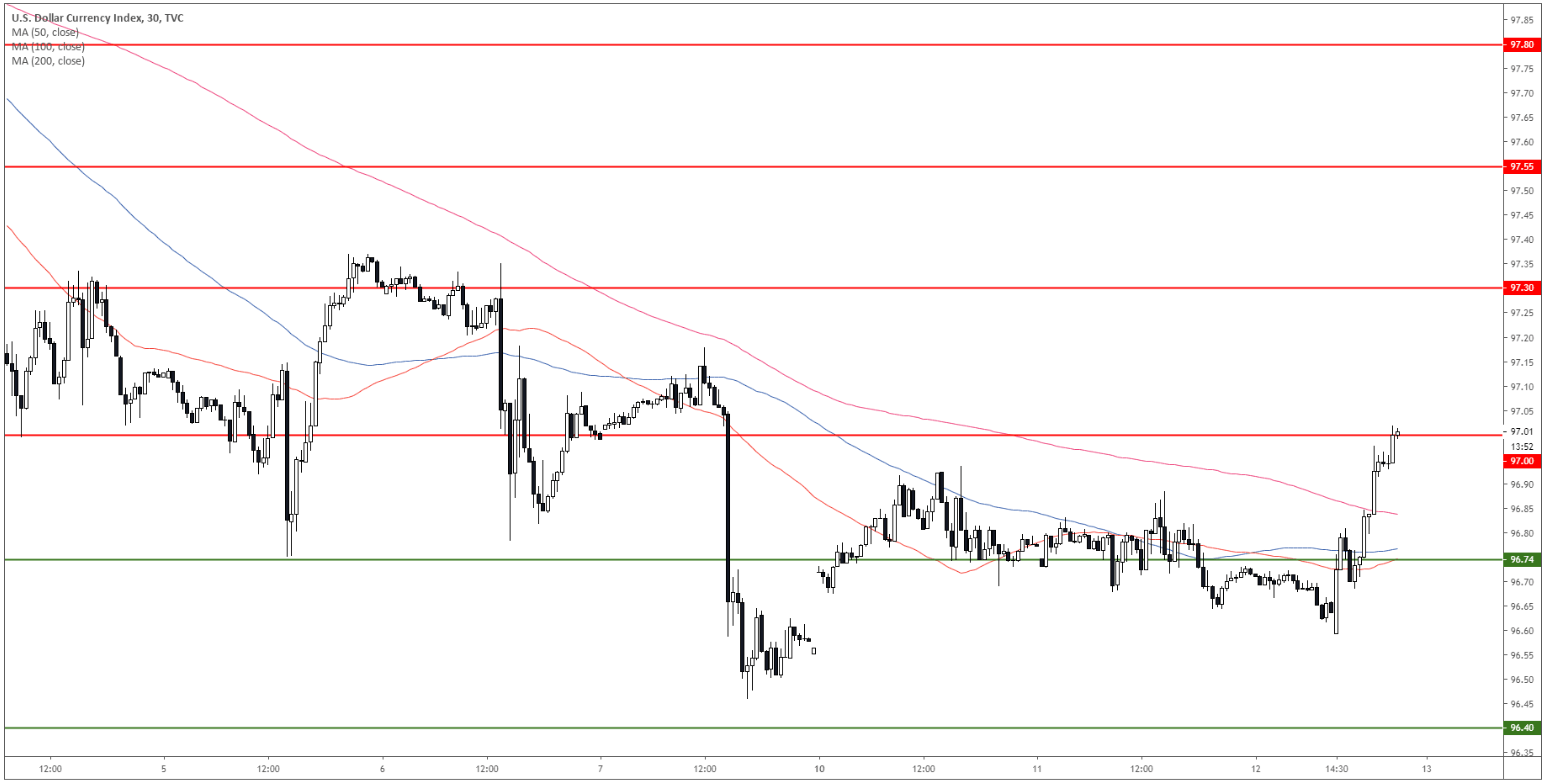
DXY 30-minute chart


DXY is under bullish pressure above its main SMAs. Bulls want a break above 97.00 and a continuation towards 97.30 and 97.55. Support is at 97.74 and 96.40. 

Additional key levels

Dollar Index Spot

Overview
Today last price97.01
Today Daily Change0.29
Today Daily Change %0.30
Today daily open96.72
 
Trends
Daily SMA2097.57
Daily SMA5097.48
Daily SMA10097.02
Daily SMA20096.56
Levels
Previous Daily High96.89
Previous Daily Low96.64
Previous Weekly High97.81
Previous Weekly Low96.46
Previous Monthly High98.38
Previous Monthly Low97.03
Daily Fibonacci 38.2%96.74
Daily Fibonacci 61.8%96.79
Daily Pivot Point S196.61
Daily Pivot Point S296.5
Daily Pivot Point S396.36
Daily Pivot Point R196.86
Daily Pivot Point R297
Daily Pivot Point R397.11

Author

Flavio Tosti

Flavio Tosti

Independent Analyst


More from Flavio Tosti
Share:

Editor's Picks

EUR/USD recedes to daily lows near 1.1850

EUR/USD keeps its bearish momentum well in place, slipping back to the area of 1.1850 to hit daily lows on Monday. The pair’s continuation of the leg lower comes amid decent gains in the US Dollar in a context of scarce volatility and thin trade conditions due to the inactivity in the US markets.

GBP/USD resumes the downtrend, back to the low-1.3600s

GBP/USD rapidly leaves behind Friday’s decent advance, refocusing on the downside and retreating to the 1.3630 region at the beginning of the week. In the meantime, the British Pound is expected to remain under the microscope ahead of the release of the key UK labour market report on Tuesday.

Gold looks inconclusive around $5,000

Gold partially fades Friday’s strong recovery, orbiting around the key $5,000 region per troy ounce in a context of humble gains in the Greenback on Monday. Additing to the vacillating mood, trade conditions remain thin amid the observance of the Presidents Day holiday in the US.

Bitcoin consolidates as on-chain data show mixed signals

Bitcoin price has consolidated between $65,700 and $72,000 over the past nine days, with no clear directional bias. US-listed spot ETFs recorded a $359.91 million weekly outflow, marking the fourth consecutive week of withdrawals.

The week ahead: Key inflation readings and why the AI trade could be overdone

It is likely to be a quiet start to the week, with US markets closed on Monday for Presidents Day. European markets are higher across the board and gold is clinging to the $5,000 level after the tamer than expected CPI report in the US reduced haven flows to precious metals.

XRP steadies in narrow range as fund inflows, futures interest rise

Ripple is trading in a narrow range between $1.45 (immediate support) and $1.50 (resistance) at the time of writing on Monday. The remittance token extended its recovery last week, peaking at $1.67 on Sunday from the weekly open at $1.43.