|

US Dollar Index Technical Analysis: DXY breaks to a new 2019 high
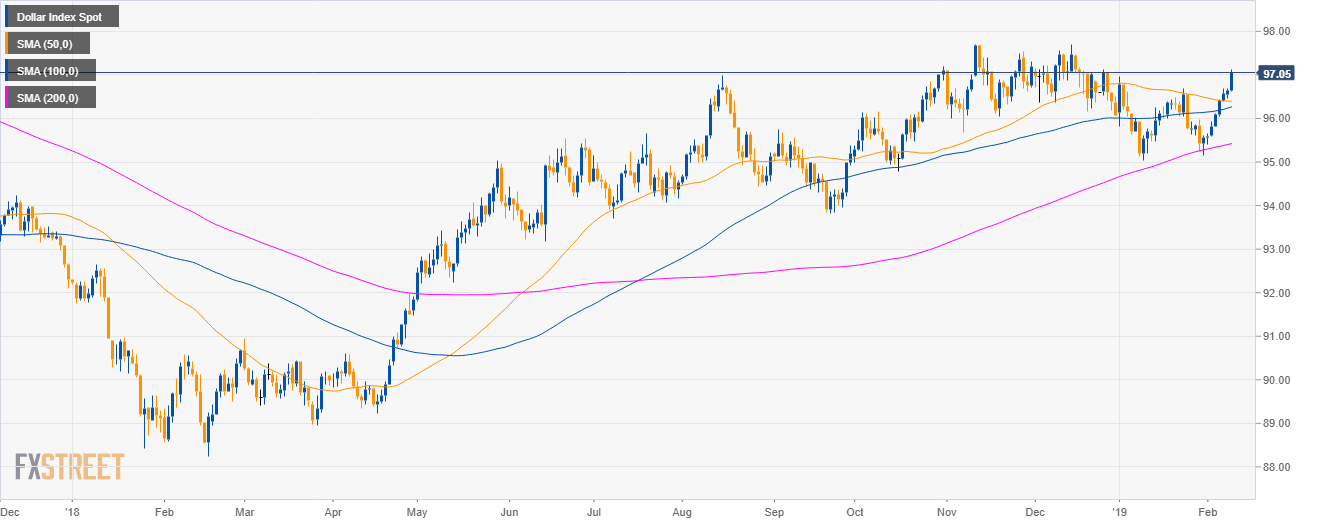
DXY daily chart

  • The US Dollar Index (DXY) is trading in a bull trend above its main simple moving averages (SMAs). 
  • DXY has reached a new 2019 high. 
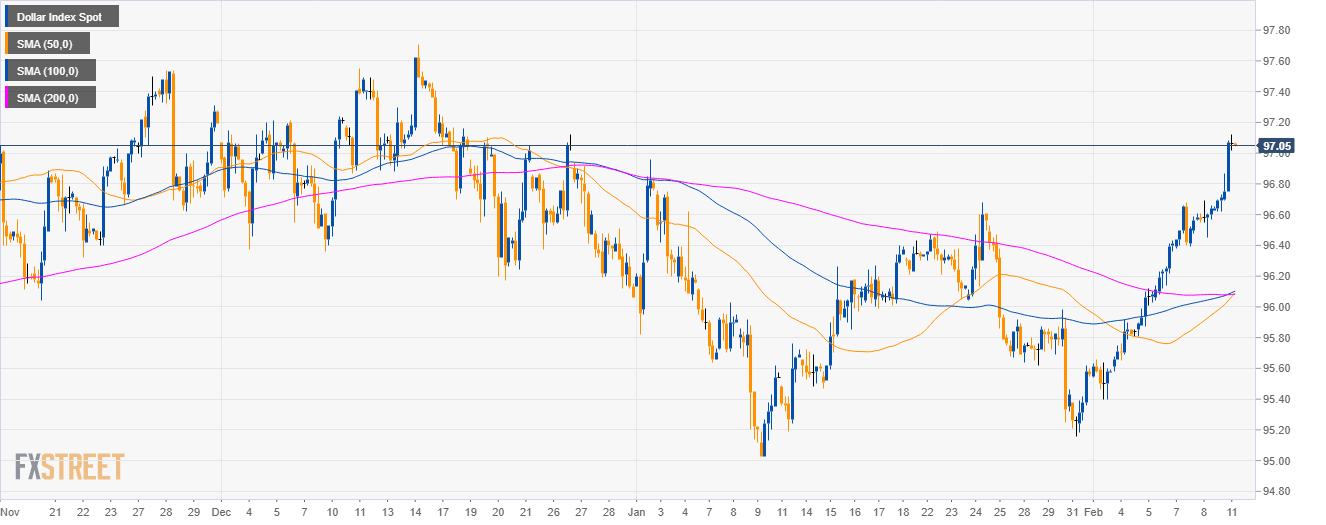
DXY 4-hour chart

  • DXY is trading above its main SMAs suggesting bullish momentum in the medium-term.

DXY 30-minute chart

  • DXY is trading above its main SMAs suggesting bullish momentum. 
  • Bulls will try to break above 97.12 in order to reach 97.40 to the upside. 
  • Supports are seen at 96.90, 96.70 and 96.40 levels. 

Dollar Index Spot

Overview:
    Today Last Price: 97.06

    Today Daily change %: 0.43%
    Today Daily Open: 96.64
Trends:
    Daily SMA20: 96.04
    Daily SMA50: 96.4
    Daily SMA100: 96.24
    Daily SMA200: 95.4
Levels:
    Previous Daily High: 96.69
    Previous Daily Low: 96.45
    Previous Weekly High: 96.69
    Previous Weekly Low: 95.58
    Previous Monthly High: 96.96
    Previous Monthly Low: 95.03
    Daily Fibonacci 38.2%: 96.6
    Daily Fibonacci 61.8%: 96.54
    Daily Pivot Point S1: 96.5
    Daily Pivot Point S2: 96.35
    Daily Pivot Point S3: 96.26
    Daily Pivot Point R1: 96.74
    Daily Pivot Point R2: 96.83
    Daily Pivot Point R3: 96.98

Additional key levels

Author

Flavio Tosti

Flavio Tosti

Independent Analyst


More from Flavio Tosti
Share:

Editor's Picks

EUR/USD tests nine-day EMA support near 1.1850

EUR/USD inches lower during the Asian hours on Monday, trading around 1.1870 at the time of writing. The 14-day Relative Strength Index momentum indicator at 56 stays above the midline, confirming improving momentum. RSI has cooled from prior overbought readings but stabilizes above 50, suggesting dips could stay limited before buyers reassert control.

GBP/USD flat lines as traders await key UK macro data and FOMC minutes

The GBP/USD pair kicks off a new week on a subdued note and oscillates in a narrow range, just below mid-1.3600s, during the Asian session. Moreover, the mixed fundamental backdrop warrants some caution for aggressive traders as the market focus now shifts to this week's important releases from the UK and the US.

Gold slides below $5,000 amid USD uptick and positive risk tone; downside seems limited

Gold attracts fresh sellers at the start of a new week and reverses a part of Friday's strong move up of over $150 from sub-$4,900 levels. The commodity slides back below the $5,000 psychological mark during the Asian session, though the downside potential seems limited amid a combination of supporting factors.

Bitcoin, Ethereum and Ripple consolidate within key ranges as selling pressure eases

Bitcoin and Ethereum prices have been trading sideways within key ranges following the massive correction. Meanwhile, XRP recovers slightly, breaking above the key resistance zone. The top three cryptocurrencies hint at a potential short-term recovery, with momentum indicators showing fading bearish signs.

Global inflation watch: Signs of cooling services inflation

Realized inflation landed close to expectations in January, as negative base effects weighed on the annual rates. Remaining sticky inflation is largely explained by services, while tariff-driven goods inflation remains limited even in the US.

Ripple Price Forecast: XRP potential bottom could be in sight

Ripple edges up above the intraday low of $1.35 at the time of writing on Friday amid mixed price actions across the crypto market. The remittance token failed to hold support at $1.40 the previous day, reflecting risk-off sentiment amid a decline in retail and institutional sentiment.