US Dollar Index Price Index: DXY bears attack key support above 91.00
- DXY stays depressed near two-week low, marked earlier in Asia.
- Momentum recovers but remains weak, suggests further downside on the trend line breakdown.
- 100-SMA, a fortnight-old horizontal support zone test short-term sellers.
- Bulls need to cross 92.00 to retake controls.

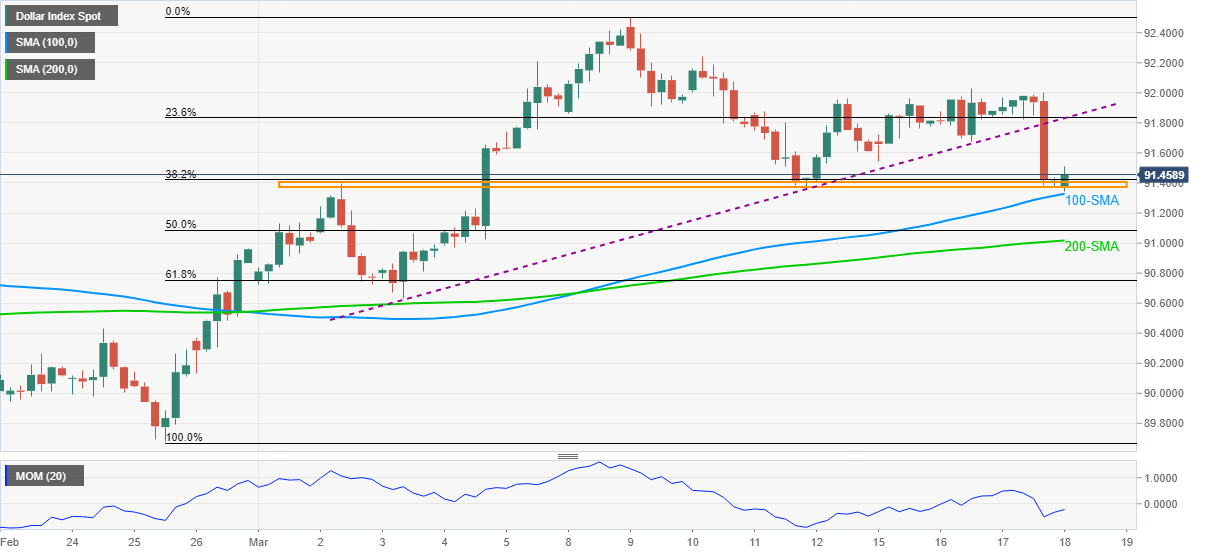
US dollar index (DXY) fades early Asian bounce off two-week low while easing to 91.42 amid the initial Thursday. However, post-Fed breakdown of an ascending trend line from March 03 directs the bears to battle key horizontal support and 100-SMA by the press time.
Given the RSI uptick from oversold conditions, the greenback bears are waiting for a major push to the south to break the 91.40-32 area comprising multiple levels marked since March 02 and 100-SMA.
While sustained trading below 91.32 will eye 200-SMA level of 91.00, any further weakness should conquer the 61.8% Fibonacci retracement of February 25 to March 09 upside, at 90.75, to recall the DXY bears.
On the contrary, the corrective pullback may dwindle around 91.70, a break of which will eye to cross the previous support line and 23.6% Fibonacci retracement around 91.85.
Even if the greenback buyers rise past-91.85, a clear rise beyond the 92.00 threshold becomes necessary for the bulls to mark dominance and refresh the monthly high above 92.50 during any further upside.
DXY four-hour chart
Trend: Bearish
Author

Anil Panchal
FXStreet
Anil Panchal has nearly 15 years of experience in tracking financial markets. With a keen interest in macroeconomics, Anil aptly tracks global news/updates and stays well-informed about the global financial moves and their implications.


