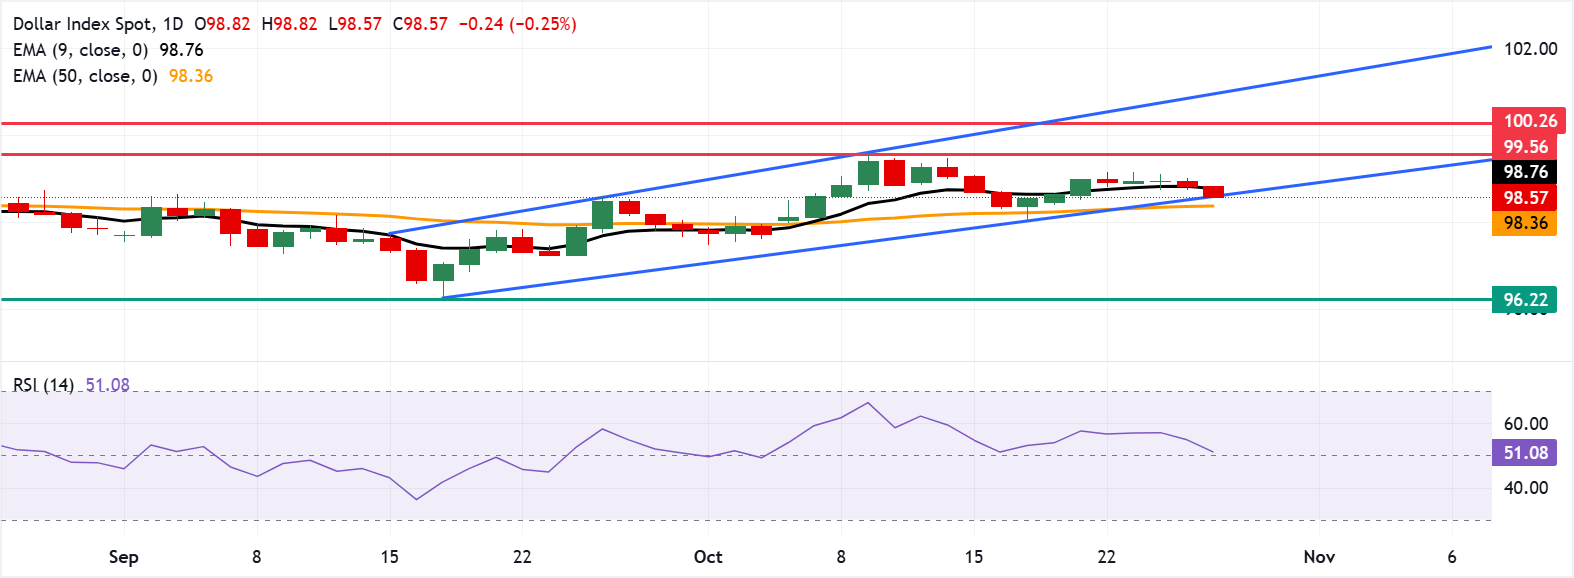
US Dollar Index Price Forecast: Tests lower ascending channel boundary around 98.50
- US Dollar Index is attempting to break below the ascending channel around 98.50.
- The 14-day Relative Strength Index is positioned at the 50 level, suggesting the market bias is neutral.
- The primary barrier lies at the nine-day EMA at 98.76.

The US Dollar Index (DXY), which measures the value of the US Dollar (USD) against six major currencies, is extending its losses for the second consecutive day and trading around 98.60 during the Asian hours on Tuesday. The technical analysis of the daily chart shows the dollar index testing the lower boundary of the ascending channel pattern, suggesting a potential shift in momentum from bullish to bearish.
The short-term price momentum is weaker as the DXY moved below the nine-day Exponential Moving Average (EMA). Additionally, the 14-day Relative Strength Index (RSI) is positioned at the 50 level, indicating the market bias is neutral. Further movements will offer a clear directional bias.
On the downside, a successful break below the ascending channel around the psychological level of 98.50 would prompt the US Dollar Index to test the 50-day EMA at 98.36. Further declines below this confluence support zone would open the doors for the DXY to navigate the region around the 96.22, the lowest since February 2022, reached on September 17.
The US Dollar Index may attempt to break above the nine-day EMA at 98.76 to strengthen the short-term price momentum, which could lead the dollar index to approach the two-month high of 99.56, which was reached on October 9. Further resistance lies at the five-month high of 100.26, which was recorded on August 1, followed by the ascending channel’s upper boundary around 101.00.
US Dollar Index: Daily Chart
US Dollar FAQs
The US Dollar (USD) is the official currency of the United States of America, and the ‘de facto’ currency of a significant number of other countries where it is found in circulation alongside local notes. It is the most heavily traded currency in the world, accounting for over 88% of all global foreign exchange turnover, or an average of $6.6 trillion in transactions per day, according to data from 2022. Following the second world war, the USD took over from the British Pound as the world’s reserve currency. For most of its history, the US Dollar was backed by Gold, until the Bretton Woods Agreement in 1971 when the Gold Standard went away.
The most important single factor impacting on the value of the US Dollar is monetary policy, which is shaped by the Federal Reserve (Fed). The Fed has two mandates: to achieve price stability (control inflation) and foster full employment. Its primary tool to achieve these two goals is by adjusting interest rates. When prices are rising too quickly and inflation is above the Fed’s 2% target, the Fed will raise rates, which helps the USD value. When inflation falls below 2% or the Unemployment Rate is too high, the Fed may lower interest rates, which weighs on the Greenback.
In extreme situations, the Federal Reserve can also print more Dollars and enact quantitative easing (QE). QE is the process by which the Fed substantially increases the flow of credit in a stuck financial system. It is a non-standard policy measure used when credit has dried up because banks will not lend to each other (out of the fear of counterparty default). It is a last resort when simply lowering interest rates is unlikely to achieve the necessary result. It was the Fed’s weapon of choice to combat the credit crunch that occurred during the Great Financial Crisis in 2008. It involves the Fed printing more Dollars and using them to buy US government bonds predominantly from financial institutions. QE usually leads to a weaker US Dollar.
Quantitative tightening (QT) is the reverse process whereby the Federal Reserve stops buying bonds from financial institutions and does not reinvest the principal from the bonds it holds maturing in new purchases. It is usually positive for the US Dollar.
Author

Akhtar Faruqui
FXStreet
Akhtar Faruqui is a Forex Analyst based in New Delhi, India. With a keen eye for market trends and a passion for dissecting complex financial dynamics, he is dedicated to delivering accurate and insightful Forex news and analysis.


