US Dollar Index Price Forecast: Remains within confluence zone around 97.50 barrier
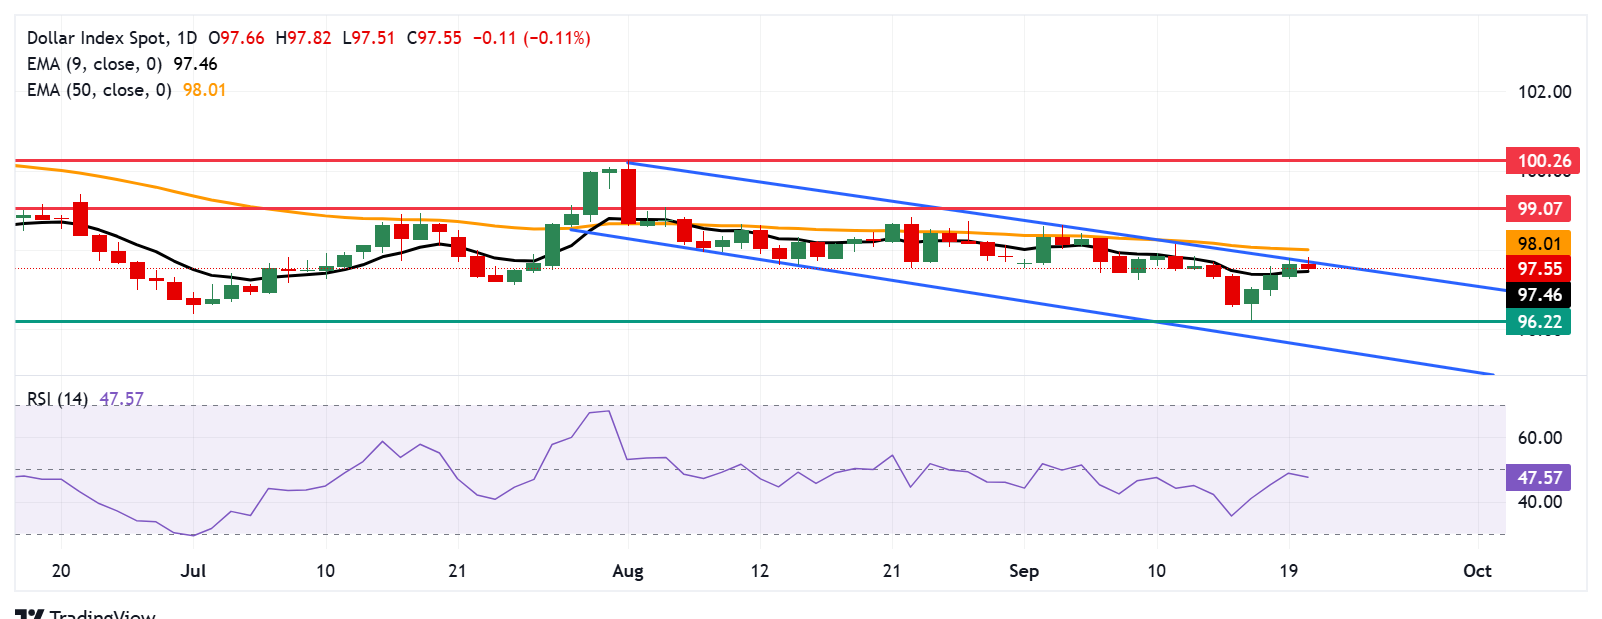
- US Dollar Index tests its immediate barrier at the descending channel’s upper boundary around 97.70.
- Bearish bias is still in play as the 14-day Relative Strength Index remains slightly below the 50 level.
- The initial support appears at the nine-day EMA of 97.46.

The US Dollar Index (DXY), which measures the value of the US Dollar (USD) against six major currencies, is halting its three-day winning streak and trading around 97.50 during the European hours on Monday. The technical analysis of the daily chart shows the dollar index testing to break above the descending channel pattern, suggesting a potential for a bullish shift.
The short-term price momentum is strengthening as the DXY has moved above the nine-day Exponential Moving Average (EMA) and may target upside toward the 50-day EMA. However, the 14-day Relative Strength Index (RSI) still holds below the 50 level, indicating that bearish bias is still in play.
A successful breach above the descending channel’s upper boundary around 97.70 would cause the emergence of the bullish bias and support the DXY to test the 50-day EMA at 98.01. Further advances above this confluence resistance zone would improve the medium-term price momentum and support the dollar index to explore the area around its eight-week high of 99.07, recorded on August 5.
On the downside, the US Dollar Index is finding the immediate support at the nine-day EMA of 97.46. A break below this level would weaken the short-term price momentum and put downward pressure on the DXY to navigate the region around the 96.22, the lowest since February 2022, reached on September 17. Further declines would prompt the dollar index to test the lower boundary of the descending channel around 95.60.
US Dollar Index: Daily Chart
US Dollar Price Today
The table below shows the percentage change of US Dollar (USD) against listed major currencies today. US Dollar was the weakest against the British Pound.
| USD | EUR | GBP | JPY | CAD | AUD | NZD | CHF | |
|---|---|---|---|---|---|---|---|---|
| USD | -0.15% | -0.21% | -0.04% | 0.18% | 0.08% | 0.15% | -0.03% | |
| EUR | 0.15% | -0.05% | 0.09% | 0.30% | 0.19% | 0.27% | 0.09% | |
| GBP | 0.21% | 0.05% | 0.06% | 0.38% | 0.26% | 0.35% | 0.18% | |
| JPY | 0.04% | -0.09% | -0.06% | 0.21% | 0.10% | 0.19% | 0.00% | |
| CAD | -0.18% | -0.30% | -0.38% | -0.21% | -0.11% | -0.02% | -0.18% | |
| AUD | -0.08% | -0.19% | -0.26% | -0.10% | 0.11% | 0.09% | -0.08% | |
| NZD | -0.15% | -0.27% | -0.35% | -0.19% | 0.02% | -0.09% | -0.20% | |
| CHF | 0.03% | -0.09% | -0.18% | -0.00% | 0.18% | 0.08% | 0.20% |
The heat map shows percentage changes of major currencies against each other. The base currency is picked from the left column, while the quote currency is picked from the top row. For example, if you pick the US Dollar from the left column and move along the horizontal line to the Japanese Yen, the percentage change displayed in the box will represent USD (base)/JPY (quote).
Author

Akhtar Faruqui
FXStreet
Akhtar Faruqui is a Forex Analyst based in New Delhi, India. With a keen eye for market trends and a passion for dissecting complex financial dynamics, he is dedicated to delivering accurate and insightful Forex news and analysis.


