US Dollar Index Price Analysis: Tuesday’s hanging man teases DXY sellers around 99.00
- DXY snapped three-day uptrend to reverse from 22-month high, sidelined
- Bearish candlestick formation, overbought RSI hints at a pullback.
- 10-DMA offers immediate support, 97-80-75 appears a tough nut to crack for bears.
- Tops marked during late 2019, early 2020 will lure buyers during fresh upside.

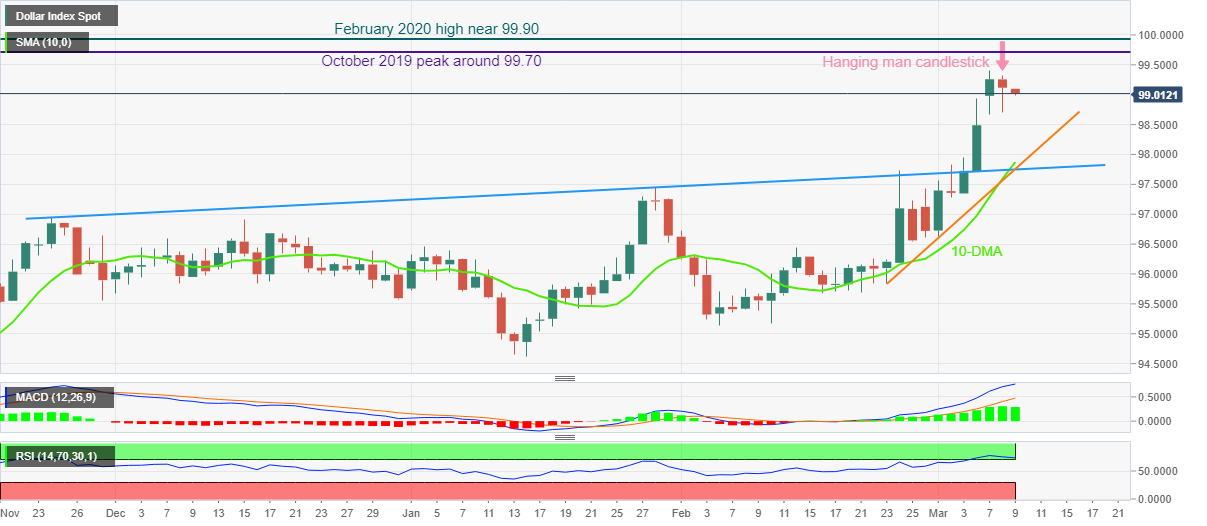
US Dollar Index (DXY) holds onto the previous day’s pullback from the multi-day top as sellers attack 99.00 during Wednesday’s Asian session.
The greenback gauge printed a bearish candlestick, namely hanging man, as it reversed from the highest levels since May 2020 while printing the first negative daily closing in four.
The pullback moves gain support from the overbought RSI to hint at the quote’s further declines.
That said, the 98.00 threshold and the 10-DMA level of 97.87 gain the DXY bear’s immediate attention.
However, ascending trend lines from late November 2021 and February 2022 joins the mid-2020 peak to highlight 97.80-75 as the key support to watch for the US Dollar Index bears afterward.
Alternatively, further recovery needs to cross the latest high of 99.41 to convince the DXY bulls.
Following that, hints marked during October 2019 and February 2020, respectively around 99.70 and 99.90, will challenge the quote’s further upside ahead of directing it towards the 100.00 psychological manget.
DXY: Daily chart
Trend: Pullback expected
Author

Anil Panchal
FXStreet
Anil Panchal has nearly 15 years of experience in tracking financial markets. With a keen interest in macroeconomics, Anil aptly tracks global news/updates and stays well-informed about the global financial moves and their implications.


