|

US Dollar Index Price Analysis: Looks neutral/bearish near-term

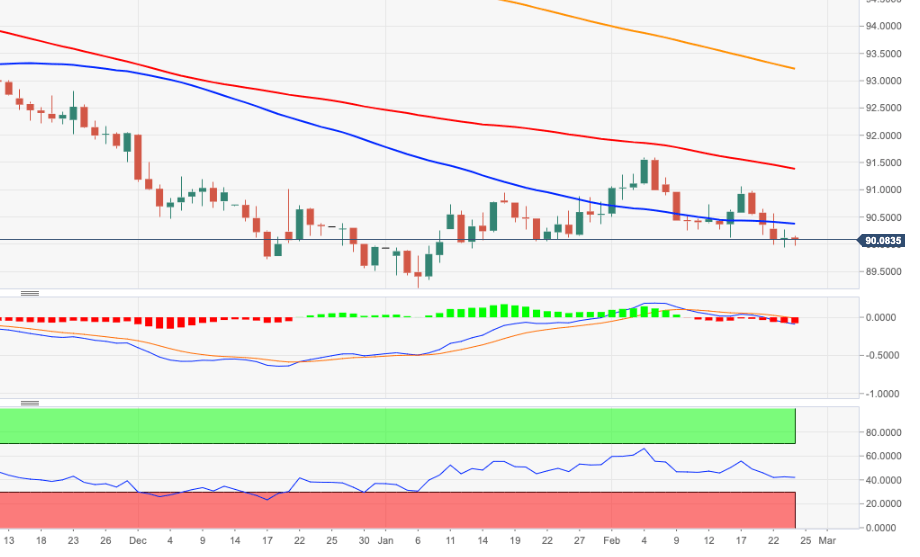
  • DXY extends the consolidative mood around 90.00.
  • Further south of this level comes in the 2021 lows at 89.20.

DXY keeps the rangebound trading in the 90.00 region, always supported by the key 2020-2021 support line (near 89.80).

While further consolidation around this area is not ruled out, the psychological support at 90.00 emerges as a crucial barrier for USD-sellers. A breakdown of this zone should open the door to a probable move to the 2021 lows around 89.20 (January 6) ahead of the March 2018 low at 88.94.

In the meantime, occasional bouts of upside pressure in the index are deemed as corrective only amidst the broader bearish view on the dollar. That said, bullish attempts to the 91.00 hurdle and beyond could represent selling opportunities against the current backdrop.

In the longer run, as long as DXY trades below the 200-day SMA (93.21), the negative stance is expected to persist.

DXY daily chart
Dollar Index Spot

Overview
Today last price90.11
Today Daily Change18
Today Daily Change %-0.01
Today daily open90.12
 
Trends
Daily SMA2090.66
Daily SMA5090.36
Daily SMA10091.42
Daily SMA20093.27
 
Levels
Previous Daily High90.27
Previous Daily Low89.94
Previous Weekly High91.06
Previous Weekly Low90.12
Previous Monthly High90.95
Previous Monthly Low89.21
Daily Fibonacci 38.2%90.14
Daily Fibonacci 61.8%90.07
Daily Pivot Point S189.95
Daily Pivot Point S289.79
Daily Pivot Point S389.63
Daily Pivot Point R190.27
Daily Pivot Point R290.43
Daily Pivot Point R390.6

Author

Pablo Piovano

Born and bred in Argentina, Pablo has been carrying on with his passion for FX markets and trading since his first college years.


More from Pablo Piovano
Share:

Editor's Picks

GBP/USD flirts with tops near 1.3470

GBP/USD manages to regain composure and challenge the area of daily highs around 1.3470 on Friday. Cable picks up pace despite marginal gains in the Greenback in a context of swelling geopolitical tensions and rising global oil prices.

Gold remains below $4,100 despite receding Fed hike bets, weak USD

Gold opens with a bullish gap at the start of a new week amid receding Fed rate-hike expectations and a bearish US Dollar. Oil prices tumbled after Trump canceled an attack on Iran and said that a deal is near, easing inflation fears. This forces traders to dial back bets on extreme Fed tightening and drags the USD to a fresh low since June 17, which, in turn, is supporting the non-yielding bullion. However, the recent repeated failures to find acceptance above $4,100 warrant caution for XAU/USD bulls.

Gold: The $4,000 mark holds the downside for now

Gold faces renewed selling pressure, falling sharply toweard the $4,000 mark per troy ounce as the US Dollar regains momentum. Escalating US-Iran tensions are keeping inflation concerns and expectations of further Fed rate hikes alive, weighing further on the yellow metal.

Week ahead: US payrolls report and AI earnings to keep investors on edge

After the Fed decision, NFP report awaited for more rate hike clues. Employment also on the agenda in Canada and New Zealand. Chinese trade and Japanese wage data to be watched too. But Iran and AI headlines to remain in driver’s seat for risk sentiment.

Middle East War updates: Trump holds off Iran strikes on pledge Hormuz deal is close

Here’s a brief recap of the key developments in the Middle East war that occurred over the weekend, which are expected to have a significant impact on markets in the upcoming week. Risk sentiment improves on Monday, undermining demand for the US Dollar Index and drag crude oil prices lower.

9-3: Is the Federal Reserve’s vote tally Warsh's new forward guidance?
The rate did not move. Neither did the statement, and that’s the more interesting fact. Set the July 29 Federal Open Market Committee (FOMC) statement beside the one issued on June 17, and the two documents are identical apart from a single verb and a paragraph at the bottom naming three dissenters.