|

US Dollar Index Price Analysis: Further south comes in the 200-day SMA

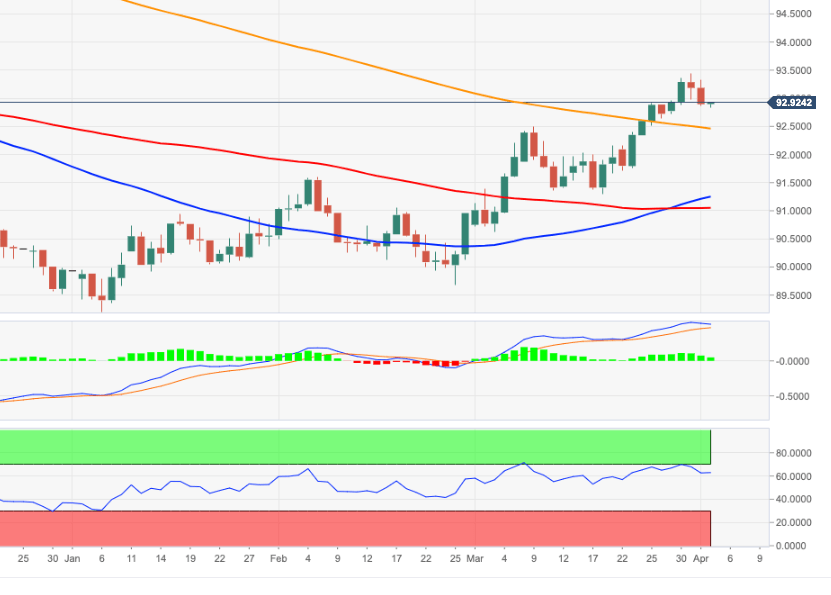
  • DXY extends the corrective downside to 92.85/80 band.
  • Immediate contention is located at the 200-day SMA at 92.45.

The dollar extends the rejection from recent yearly highs near 93.50 and re-visits the 92.80 zone on Friday.

If the selling impulse gains further traction, then DXY could re-visit the key 200-day SMA in the mid-92.00s.

A convincing return to the area below the 200-day SMA should negate the ongoing near-term constructive stance.

DXY daily chart

Dollar Index Spot

Overview
Today last price92.92
Today Daily Change10
Today Daily Change %0.03
Today daily open92.89
 
Trends
Daily SMA2092.23
Daily SMA5091.28
Daily SMA10091.05
Daily SMA20092.48
 
Levels
Previous Daily High93.33
Previous Daily Low92.87
Previous Weekly High92.92
Previous Weekly Low91.71
Previous Monthly High93.44
Previous Monthly Low90.63
Daily Fibonacci 38.2%93.05
Daily Fibonacci 61.8%93.16
Daily Pivot Point S192.73
Daily Pivot Point S292.57
Daily Pivot Point S392.27
Daily Pivot Point R193.19
Daily Pivot Point R293.49
Daily Pivot Point R393.65

Author

Pablo Piovano

Born and bred in Argentina, Pablo has been carrying on with his passion for FX markets and trading since his first college years.

More from Pablo Piovano
Share:

Editor's Picks

EUR/USD falls to near 1.1600 due to persistent bearish bias

EUR/USD depreciates after registering modest gains in the previous session, trading around 1.1610 during the Asian hours on Thursday. The technical analysis of the daily chart suggests a persistent bearish bias as the EUR/USD pair remains within the descending channel pattern.

GBP/USD underperforms as UK faces stagflation risks amid Middle East war

The Pound Sterling trades lower against its major currency peers, is down 0.22% around 1.3340 against the US Dollar, during the Asian trade on Thursday. The British currency faces selling pressures amid fears that the United Kingdom economy could face stagflation risks due to higher energy prices, a situation in which inflation accelerates with economic growth and employment conditions remaining stagnant.

Gold climbs near $5,200 as Iran war fuels safe-haven demand

Gold price extends its gains for the second successive session on Thursday as traders seek safety amid the ongoing war in the Middle East. US and Israeli strikes across Iranian territory and widespread Iranian missile and drone retaliation across the Middle East, including attacks on regional targets and military sites, prolong the crisis and its impact.

Top Crypto Gainers: Decred, Zcash, and Dogecoin lead recovery as Bitcoin crosses $72,000

Bitcoin trades above $72,500 at press time on Thursday, holding its 6% gain from the previous day, contributing to a broader market recovery. The total cryptocurrency market capitalization stands at over $2.43 trillion as the broader market sentiment improves significantly.

First Venezuela, now Iran: The US-China energy war escalates

At first glance, the latest escalation involving the United States with both Iran and Venezuela looks like another chapter in a long-running geopolitical story. But viewed through a broader strategic lens, something else may be unfolding: Energy.

Cardano Price Analysis: Approaches key trendline amid bearish sentiment

Cardano (ADA) price is approaching its descending trendline around $0.28 at the time of writing, set to shape the next directional move. The derivatives metrics paint a bearish picture, with ADA’s Open Interest continuing to fall and short bets rising among traders.