|

US Dollar Index Price Analysis: Downside pressure alleviated above 91.00

  • DXY corrects lower after flirting with the 91.00 level on Monday.
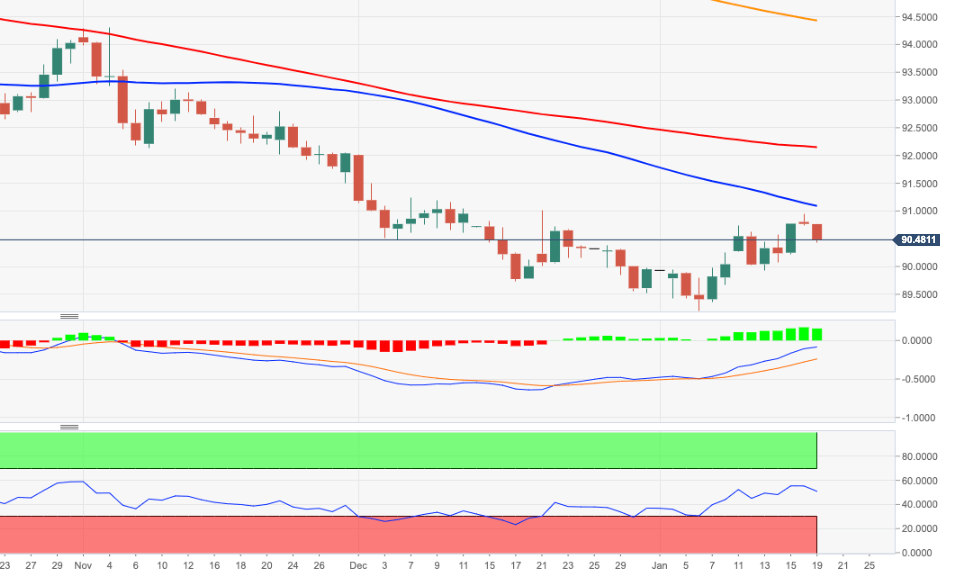
  • Interim hurdle lines up at the 55-day SMA at 91.09.

DXY met sellers in the 91.00 neighbourhood on Monday and now retreats to the 90.50 region on turnaround Tuesday.

Despite the ongoing rebound, the prospect for the greenback remains fragile. That said, a re-visit of the 90.00 yardstick should not surprise anyone in the short-term horizon. Below this psychological level is located the 2021 lows around 89.20 ahead of the March 2018 low at 88.94.

A surpass of the 91.00 region should mitigate the downside pressure somewhat. The 55-day SMA, today ay 91.09, reinforces this interim hurdle.

The ongoing rebound is seen as corrective only and in the longer run, as long as DXY trades below the 200-day SMA, today at 94.42, the negative view is forecast to persist.

DXY daily chart

Dollar Index Spot

Overview
Today last price90.49
Today Daily Change32
Today Daily Change %-0.31
Today daily open90.77
 
Trends
Daily SMA2090.14
Daily SMA5090.97
Daily SMA10092.17
Daily SMA20094.47
 
Levels
Previous Daily High90.95
Previous Daily Low90.74
Previous Weekly High90.78
Previous Weekly Low89.92
Previous Monthly High92.02
Previous Monthly Low89.52
Daily Fibonacci 38.2%90.82
Daily Fibonacci 61.8%90.87
Daily Pivot Point S190.69
Daily Pivot Point S290.61
Daily Pivot Point S390.48
Daily Pivot Point R190.9
Daily Pivot Point R291.03
Daily Pivot Point R391.11

Author

Pablo Piovano

Born and bred in Argentina, Pablo has been carrying on with his passion for FX markets and trading since his first college years.

More from Pablo Piovano
Share:

Markets move fast. We move first.

Orange Juice Newsletter brings you expert driven insights - not headlines. Every day on your inbox.

By subscribing you agree to our Terms and conditions.

Editor's Picks

EUR/USD remains below 1.1700 amid weakening momentum

EUR/USD remains steady after four days of losses, trading around 1.1680 during the Asian hours on Thursday. On the daily chart, the 14-day Relative Strength Index at 42.6 (neutral-bearish) indicates weakening momentum after slipping below the 50 midline. RSI staying sub-50 would keep bears engaged and limit recovery attempts.

GBP/USD consolidates above mid-1.3400s; bullish potential seems intact

The GBP/USD pair is seen consolidating its heavy losses registered over the past two days and oscillating in a narrow trading band, just above mid-1.3400s during the Asian session on Thursday. However, the fundamental backdrop warrants some caution for bearish traders and before positioning for an extension of the retracement slide from the 1.3565-1.3570 region, or the highest level since September 18, touched on Tuesday.

Gold: Deeper correction or dip-buying likely?

Gold is nursing losses near $4,450 in Asian trading on Thursday, having suffered about a 1% correction from weekly highs of $4,500 on Wednesday. All eyes remain on the geopolitical developments and the incoming US jobless claims data for fresh trading directives.

XRP faces selling pressure as key on-chain metric resets and ETF inflows weaken

Ripple (XRP) is trading downward but holding support at $2.22 at the time of writing on Wednesday, as fear spreads across the cryptocurrency market, reversing gains made from the start of the year.

2026 economic outlook: Clear skies but don’t unfasten your seatbelts yet

Most years fade into the background as soon as a new one starts. Not 2025: a year of epochal shifts, in which the macroeconomy was the dog that did not bark. What to expect in 2026? The shocks of 2025 will not be undone, but neither will they be repeated.

XRP battles selling pressure as profit-taking, ETF inflows shape outlook

Ripple (XRP) is trading downward but holding support at $2.22 at the time of writing on Wednesday, as fear spreads across the cryptocurrency market, reversing gains made from the start of the year.