US Dollar comes to a halt at the end of a very volatile week
- The US Dollar erases earlier losses and heads back to flat.
- The technical picture raises a worrying sign for the coming weeks.
- The US Dollar index closed above a key level on Thursday.

The US Dollar (USD) started on the back foot again on Friday and has been able to erase earlier incurred losses towards the US opening bell this Friday. As such, there is no issue, seeing that the US Dollar Index has been able to print three consecutive days of gains. The effect of the lower-than-expected Initial Jobless Claims print from Thursday is quickly fading, and with an empty calendar ahead, it could be a day of more outflow for the US Dollar ahead of the weekend.
On the economic data front, there is an empty calendar ahead with no data points that will move markets or the US Dollar. This means that either headlines or geopolitical events will drive markets to close the week. The weekly close for the US Dollar will be vital ahead of next week when the US Consumer Price Index (CPI) and the US Retail Sales data for July are on the docket.
Daily digest market movers: Let's see next week
- A slew of US Federal Reserve (Fed) members left a few comments overnight in terms of where they see the Fed policy at the moment:
- President of the Federal Reserve Bank of Chicago Austan Goolsbee said that the Fed is watching markets, though that does not influence the Fed’s policy. Goolsbee also expressed his unease that the Fed would cut so close to US elections.
- Kansas City Fed President Jeffrey Schmid said that it is appropriate to cut when inflation continues to come in low. Schmid also noted that the job market is still in very good shape.
- China’s data this week remained very disappointing after imports surpassed exports, making the Chinese main exporter suddenly an importer for the month of July. More concerns are now at hand, with Consumer Prices rising 0.5% against July last year. The People’s Bank of China (PBoC) might be forced to raise rates in order to tame inflation, while it wants to keep rates low or even lower in order to boost exports.
- Equity markets look a bit two-faced on Friday, with Asian stocks closed in positive territory, while European indices and US futures are mildly negative.
- The CME Fedwatch Tool shows a 54.5% chance of a 50 basis points (bps) interest rate cut by the Federal Reserve (Fed) in September against a 45.5% chance for only 25 bps. Another 25 bps cut (if September is a 50 bps cut) is expected in November by 51.9%, while a 15.8% chance for a 50 bps cut and 32.3% for no cut are being pencilled in for that meeting.
- The US 10-year benchmark rate trades at 3.95% after popping above 4.00% briefly on Thursday.
Economic Indicator
Consumer Price Index (MoM)
Inflationary or deflationary tendencies are measured by periodically summing the prices of a basket of representative goods and services and presenting the data as The Consumer Price Index (CPI). CPI data is compiled on a monthly basis and released by the US Department of Labor Statistics. The MoM figure compares the prices of goods in the reference month to the previous month.The CPI is a key indicator to measure inflation and changes in purchasing trends. Generally, a high reading is seen as bullish for the US Dollar (USD), while a low reading is seen as bearish.
Read more.Next release: Wed Aug 14, 2024 12:30
Frequency: Monthly
Consensus: 0.2%
Previous: -0.1%
Source: US Bureau of Labor Statistics
The US Federal Reserve has a dual mandate of maintaining price stability and maximum employment. According to such mandate, inflation should be at around 2% YoY and has become the weakest pillar of the central bank’s directive ever since the world suffered a pandemic, which extends to these days. Price pressures keep rising amid supply-chain issues and bottlenecks, with the Consumer Price Index (CPI) hanging at multi-decade highs. The Fed has already taken measures to tame inflation and is expected to maintain an aggressive stance in the foreseeable future.
US Dollar Index Technical Analysis: Have a good weekend!
The US Dollar Index (DXY) faces pressure near the pivotal level of 103.18 after closing above it for the first time this week on Thursday. Thus, Friday’s close will be even more important as there could be more downside in the cards towards next week.
Still the first level to recover, which gains importance every day, is 103.18, a level held on Friday last week though snapped on Monday this week in the Asian hours.. Once the DXY closes above that level, next up is 104.00, which was the support from June. If the DXY can make its way back above that level, the 200-day Simple Moving Average (SMA) at 104.17 is the next resistance level to look out for.
On the downside, the oversold condition in the Relative Strength Index (RSI) indicator has eased in the daily chart and holds room again for a small leg lower. Support nearby is the March 8 low at 102.35. Once through there, pressure will start to build on 102.00 as a big psychological figure before testing 101.90, which was a pivotal level in December 2023 and January 2024.
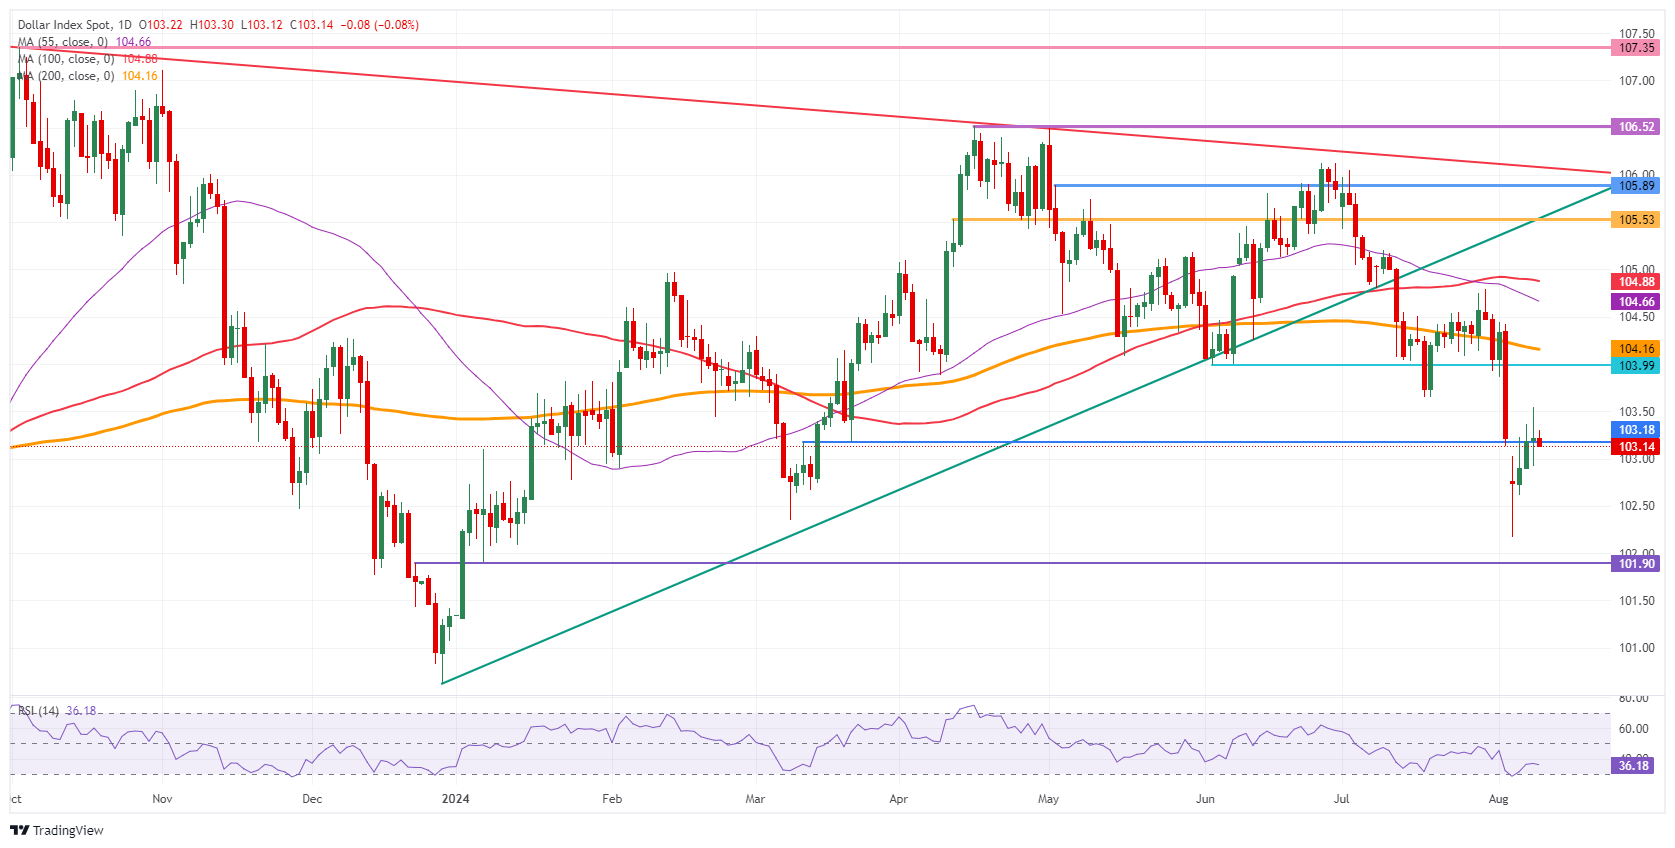
US Dollar Index: Daily Chart
Inflation FAQs
Inflation measures the rise in the price of a representative basket of goods and services. Headline inflation is usually expressed as a percentage change on a month-on-month (MoM) and year-on-year (YoY) basis. Core inflation excludes more volatile elements such as food and fuel which can fluctuate because of geopolitical and seasonal factors. Core inflation is the figure economists focus on and is the level targeted by central banks, which are mandated to keep inflation at a manageable level, usually around 2%.
The Consumer Price Index (CPI) measures the change in prices of a basket of goods and services over a period of time. It is usually expressed as a percentage change on a month-on-month (MoM) and year-on-year (YoY) basis. Core CPI is the figure targeted by central banks as it excludes volatile food and fuel inputs. When Core CPI rises above 2% it usually results in higher interest rates and vice versa when it falls below 2%. Since higher interest rates are positive for a currency, higher inflation usually results in a stronger currency. The opposite is true when inflation falls.
Although it may seem counter-intuitive, high inflation in a country pushes up the value of its currency and vice versa for lower inflation. This is because the central bank will normally raise interest rates to combat the higher inflation, which attract more global capital inflows from investors looking for a lucrative place to park their money.
Formerly, Gold was the asset investors turned to in times of high inflation because it preserved its value, and whilst investors will often still buy Gold for its safe-haven properties in times of extreme market turmoil, this is not the case most of the time. This is because when inflation is high, central banks will put up interest rates to combat it. Higher interest rates are negative for Gold because they increase the opportunity-cost of holding Gold vis-a-vis an interest-bearing asset or placing the money in a cash deposit account. On the flipside, lower inflation tends to be positive for Gold as it brings interest rates down, making the bright metal a more viable investment alternative.
Author

Filip Lagaart
FXStreet
Filip Lagaart is a former sales/trader with over 15 years of financial markets expertise under its belt.


