|

US 10-year yield rises to 7-year high, what's next?

  • The US 10-year treasury yield rose to a 7-year high of 3.095 percent.
  • The yield could rise to 3.5 percent this year, the technical charts indicate.

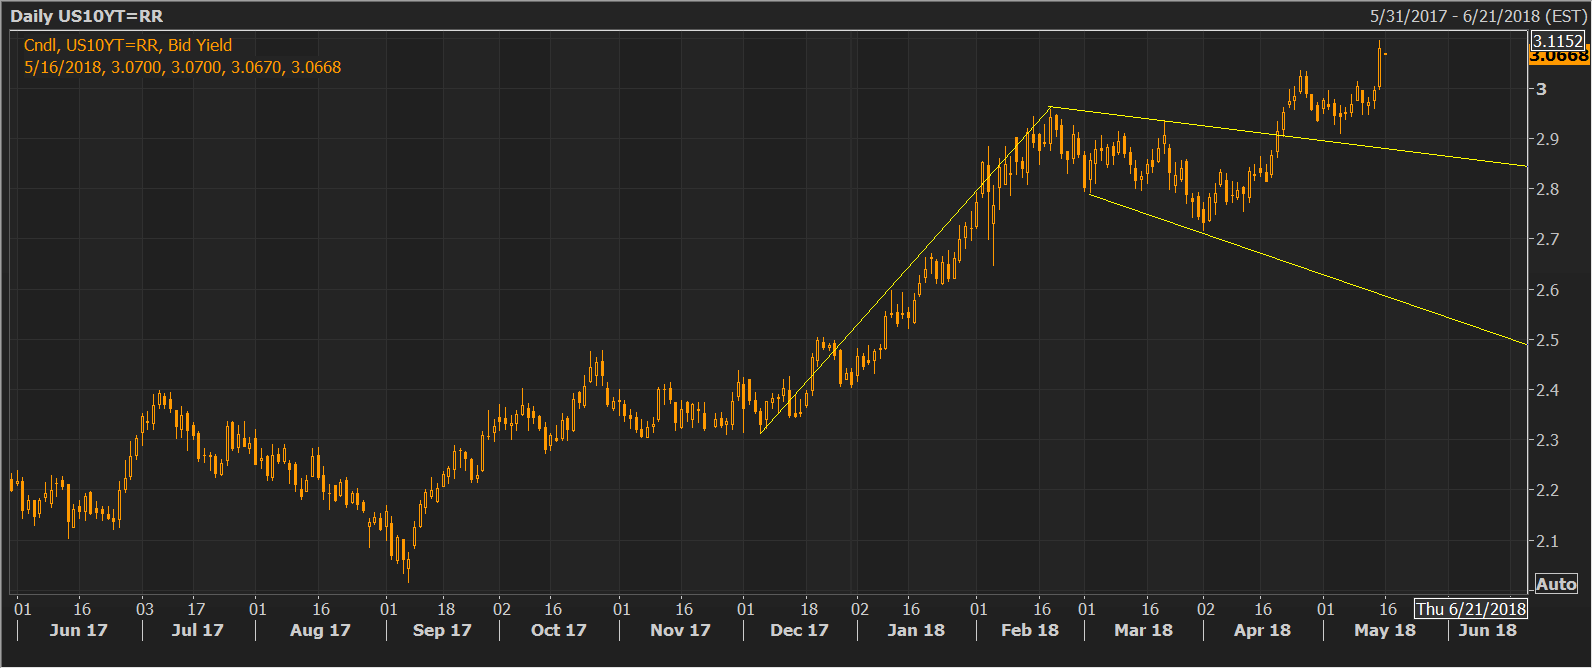
The yield on the benchmark 10-year treasury note finally cut through the resistance at 3.04 percent and rose to 3.095 percent yesterday - the highest level since 2011 and the technical charts indicate the party has just begun.

The bull flag breakout, a bullish continuation pattern, confirmed in mid-April (seen in daily chart) indicates scope for a rally to 3.5 percent.

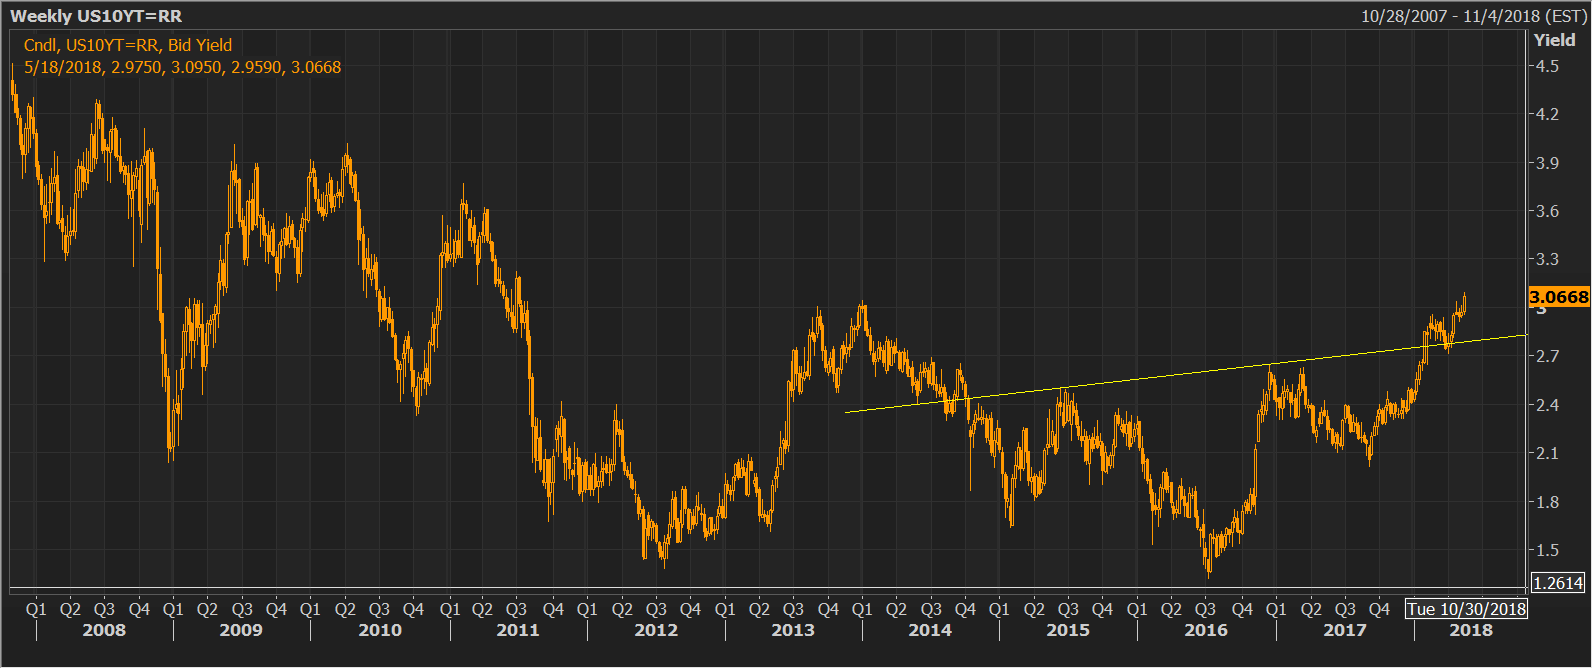
The bullish setup in the daily chart only adds credence to the long-run bearish-to-bullish trend change, as highlighted by the inverse head-and-shoulders breakout on the weekly chart.

Clearly, the 10-year yield looks set to rise in the USD-positive manner in the near future. As of writing, the yield is trading at 3.07 percent.  

Daily chart
Weekly chart
Author

Omkar Godbole

Omkar Godbole

FXStreet Contributor

Omkar Godbole, editor and analyst, joined FXStreet after four years as a research analyst at several Indian brokerage companies.


More from Omkar Godbole
Share:

Editor's Picks

GBP/USD: Daily gains remain capped by 1.3650

GBP/USD leaves behind Monday’s pessimism and advances marginally on Tuesday. Cable’s humble gains, however, appear to have met quite a decent resistance in the 1.3650 zone for now, in a context of a slight selling pressure hovering around the Greenback.

EUR/USD struggles to regain pace; gyrates around 1.1670

EUR/USD clinches humble gains around 1.1670 following Tuesday’s close on Wall Street. Indeed, marginal losses in the US Dollar encourages spot to set aside two dauly pullbacks in a row and maintain the 1.1700 barrier on the cross-hairs for now. Moving forward, US inflation tracked by the PCE and another revision of Q2 GDP data should keep investors entertained on Wednesday.

Gold steadies near $4,650, eyes multi-month high ahead of US PCE

Gold stabilizes around $4,650 after the previous day's two-way swings as traders await the US PCE data, due later this Wednesday, for cues about the Fed's policy path. The outlook will drive the US Dollar and the non-yielding bullion. Meanwhile, renewed hopes for a US-Iran peace deal, weak oil prices, sliding US bond yields and diminishing odds of an immediate tightening by the Fed undermine the USD. This keeps the precious metal close to its highest level since May 14, set on Tuesday.

Australia CPI expected to show inflation easing in July
The Australian Bureau of Statistics (ABS) will publish the July Consumer Price Index (CPI) on Wednesday at 01:30 GMT. The report is expected to show that inflation rose 3.2% from a year earlier, easing from the 3.8% posted in June. The monthly CPI, however, is forecast at 0.8% following the -0.1% print from the previous month.
Canada hits US goods with tariffs; The rate market sees a problem
On September 8, Canada begins charging its own importers 15%, 25% and 50% on roughly 700 lines of American goods. The measure is billed as dollar for dollar, and on the arithmetic of covered trade it is. What it is not is a tax on the United States.
Canada hits US goods with tariffs; The rate market sees a problem
On September 8, Canada begins charging its own importers 15%, 25% and 50% on roughly 700 lines of American goods. The measure is billed as dollar for dollar, and on the arithmetic of covered trade it is. What it is not is a tax on the United States.















