|

Uranium Miners ETF (URA) correction should find support

The Global X Uranium ETF (URA) is an exchange-traded fund (ETF) that seeks to provide investment results that correspond generally to the price and yield performance of the Solactive Global Uranium & Nuclear Components Total Return Index. In this article, we will look at the long term technical outlook using Elliott Wave method.

$URA Elliott Wave monthly chart

Chart

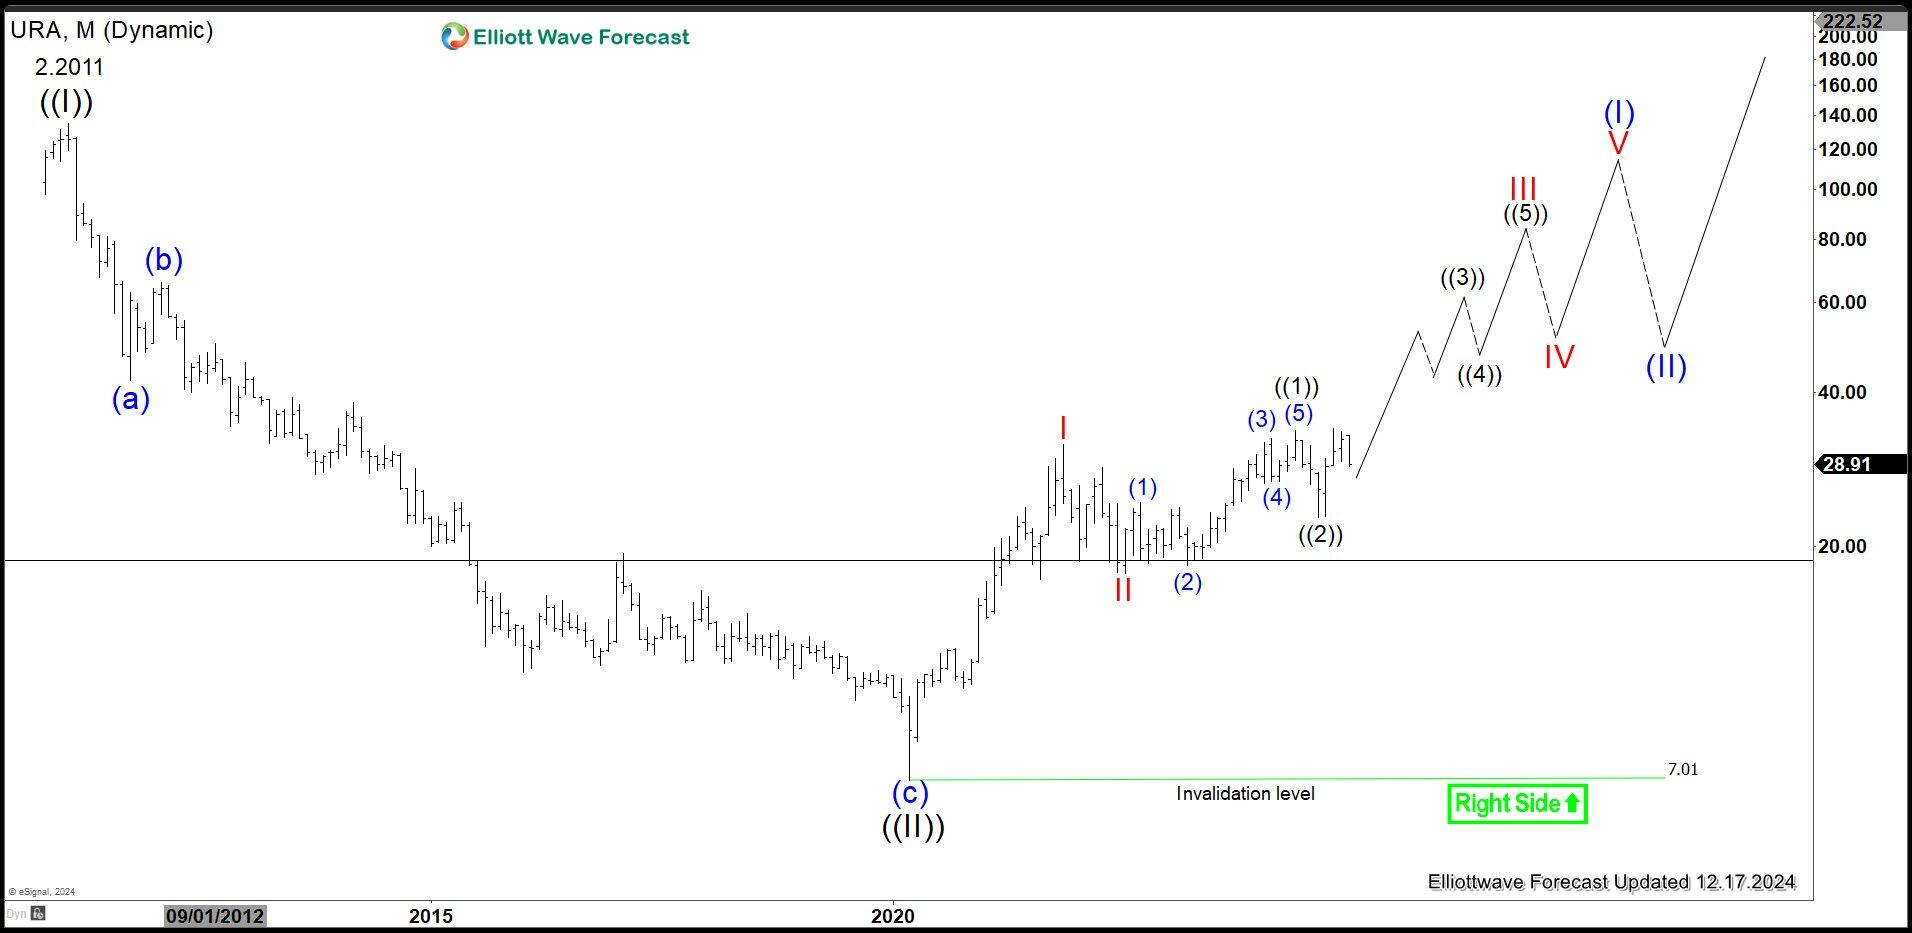
Uranium ETF (URA) Monthly Chart shows the EF has a bullish sequence after ending wave ((II)) at 7.01. Up from there, wave I ended at 31.6 and pullback in wave II ended at 17.65. The ETF then nested higher in impulsive structure with wave ((1)) ended at 33.66 and pullback in wave ((2)) ended at 22.79. Expect the ETF to continue higher in wave ((3)). Overall, it’s bullish against March 2020 low at 7.01 and pullback should find support in 3, 7, 11 swing.

$URA daily Elliott Wave chart

Chart

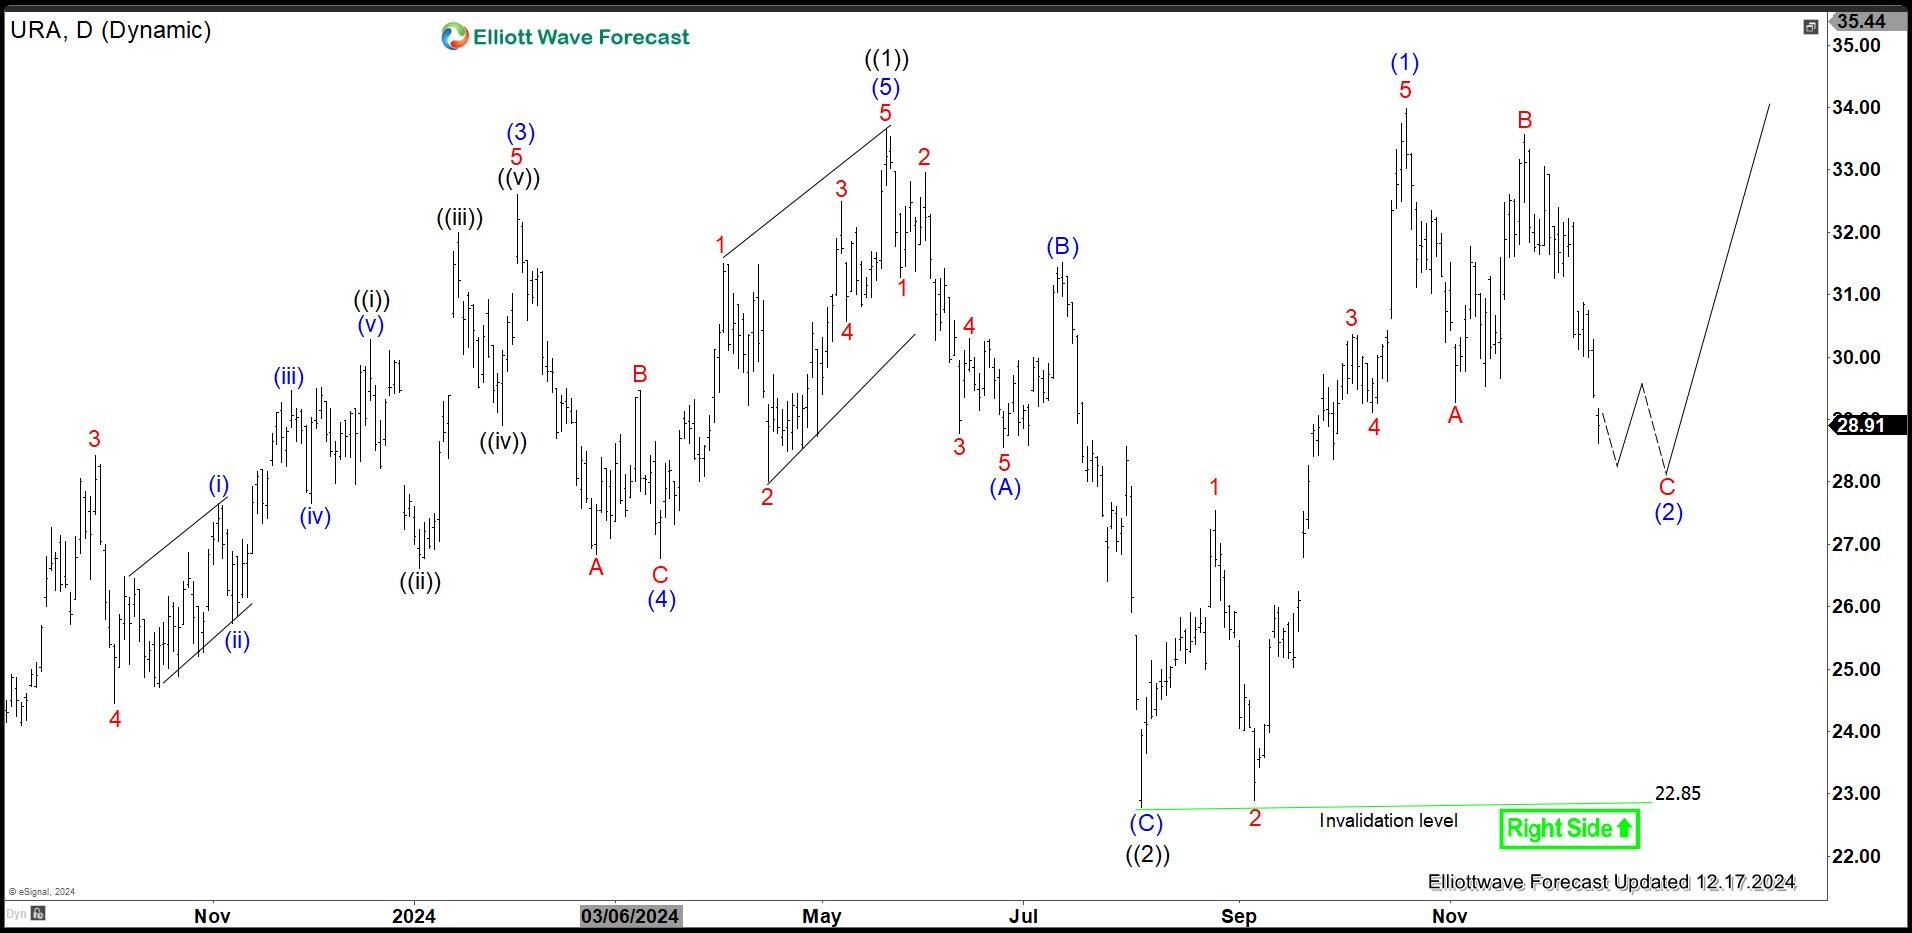
Daily chart above shows that rally to 33.66 ended wave ((1)) on May 20, 2024 high. Pullback in wave ((2)) ended a t 22.85 with internal subdivision as a zigzag Elliott Wave structure. Down from wave ((1)), wave (A) ended at 28.56 and wave (B) rally ended at 31.52. Wave (C) lower ended at 22.85 which completed wave ((2)) in higher degree. The ETF has turned higher in wave ((3)). Up from wave ((2)), wave 1 ended at 27.55 and wave 2 dips ended at 22.89. Wave 3 higher ended at 30.37 and pullback in wave 4 ended at 29.11.

Final leg wave 5 higher ended at 33.99 which completed wave (1) in higher degree. Wave (2) pullback is in progress to correct cycle from 8.5.2024 low in zigzag structure before it resumes higher. Near term, as far as pivot at 22.85 low stays intact, expect dips to find support in 3, 7, 11 swing for more upside.

Author

Elliott Wave Forecast Team

Elliott Wave Forecast Team

ElliottWave-Forecast.com

More from Elliott Wave Forecast Team
Share:

Editor's Picks

EUR/USD flirts with daily highs, retargets 1.1900

EUR/USD regains upside traction, returning to the 1.1880 zone and refocusing its attention to the key 1.1900 barrier. The pair’s slight gains comes against the backdrop of a humble decline in the US Dollar as investors continue to assess the latest US CPI readings and the potential Fed’s rate path.

GBP/USD remains well bid around 1.3650

GBP/USD maintains its upside momentum in place, hovering around daily highs near 1.3650 and setting aside part of the recent three-day drop. Cable’s improved sentiment comes on the back of the Greenback’s  irresolute price action, while recent hawkish comments from the BoE’s Pill also collaborate with the uptick.

Gold clings to gains just above $5,000/oz

Gold is reclaiming part of the ground lost on Wednesday’s marked decline, as bargain-hunters keep piling up and lifting prices past the key $5,000 per troy ounce. The precious metal’s move higher is also underpinned by the slight pullback in the US Dollar and declining US Treasury yields across the curve.

Crypto Today: Bitcoin, Ethereum, XRP in choppy price action, weighed down by falling institutional interest 

Bitcoin's upside remains largely constrained amid weak technicals and declining institutional interest. Ethereum trades sideways above $1,900 support with the upside capped below $2,000 amid ETF outflows.

Week ahead – Data blitz, Fed Minutes and RBNZ decision in the spotlight

US GDP and PCE inflation are main highlights, plus the Fed minutes. UK and Japan have busy calendars too with focus on CPI. Flash PMIs for February will also be doing the rounds. RBNZ meets, is unlikely to follow RBA’s hawkish path.

Ripple Price Forecast: XRP potential bottom could be in sight

Ripple edges up above the intraday low of $1.35 at the time of writing on Friday amid mixed price actions across the crypto market. The remittance token failed to hold support at $1.40 the previous day, reflecting risk-off sentiment amid a decline in retail and institutional sentiment.