Unilever is a multinational consumer goods corporation. Unilever products include food, condiments, ice cream, coffee, cleaning agents, pet food, beauty products, personal care and more. Founded 1919 by the merger of the Dutch margarine producer Margarine Unie and the British soapmaker Lever Brothers, it is headquartered in London, UK.  Unilever is a part of FTSE 100, AEX and Eurostoxx 50 indices. Investors can trade it under the tickers $ULVR at LSE, $UNA at Euronext Amsterdam and under $UL at NYSE. Corporation Unilever owns over 400 brands. Among them, the trademarks like Dove, Omo/Persil, Knorr, Lipton, Magnum, Rexona/Degree and others. The company products are present in 190 countries.

The stock price of Unilever is in a permanent rally from the all-time lows. From march 2020 bottom, one can see a new cycle higher. This might be the final push higher within the larger cycle. Once ended, Unilever should pull back against the all-time lows which will provide again an opportunity to join the success story of Unilever stock price action.

In the initial article from October 2021, we have provided with an area where investors can join the rally. As a matter of fact, the price made a dip into 40.36-38.42 area and reacted higher. In the last article from February 2023, we have explained that short term pullbacks should find support in 3, 7 swings. Now, we recognize the overall structure as a bullish triangle. Once ended, a thrust higher should take place.

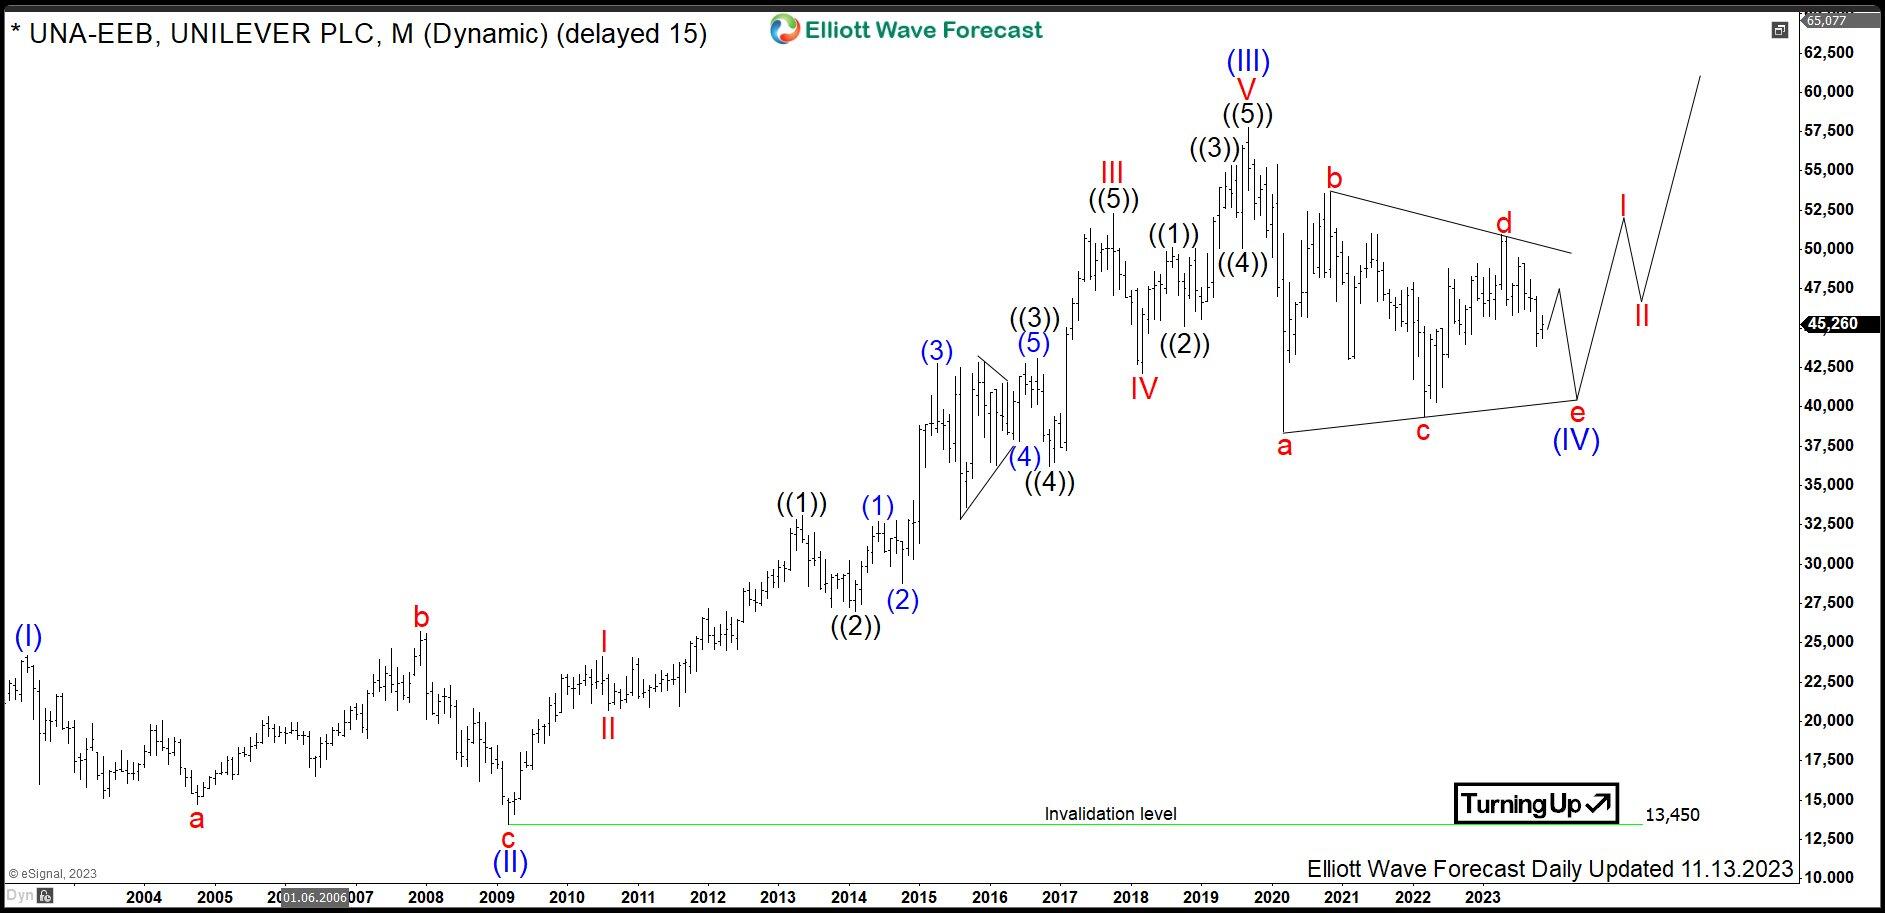
Unilever monthly Elliott Wave analysis 11.14.2023

The monthly chart below shows the Unilever shares $UNA traded at Euronext Amsterdam. From the all-time lows, the stock price is within the larger impulse as wave ((I)). Hereby, Unilever has finished the waves (I)-(III) by printing the all-time high on September 2019 at 57.77. Within the impulsive advance in wave (III), the internals I and III are impulsive waves, too. From the September 2019 highs, a correction lower in wave (IV) is unfolding as a bullish triangle being 3-3-3-3-3 structure. Once ended, expect thrust higher in blue wave (V).  The target for wave (V) is 62.33-69.72 area.

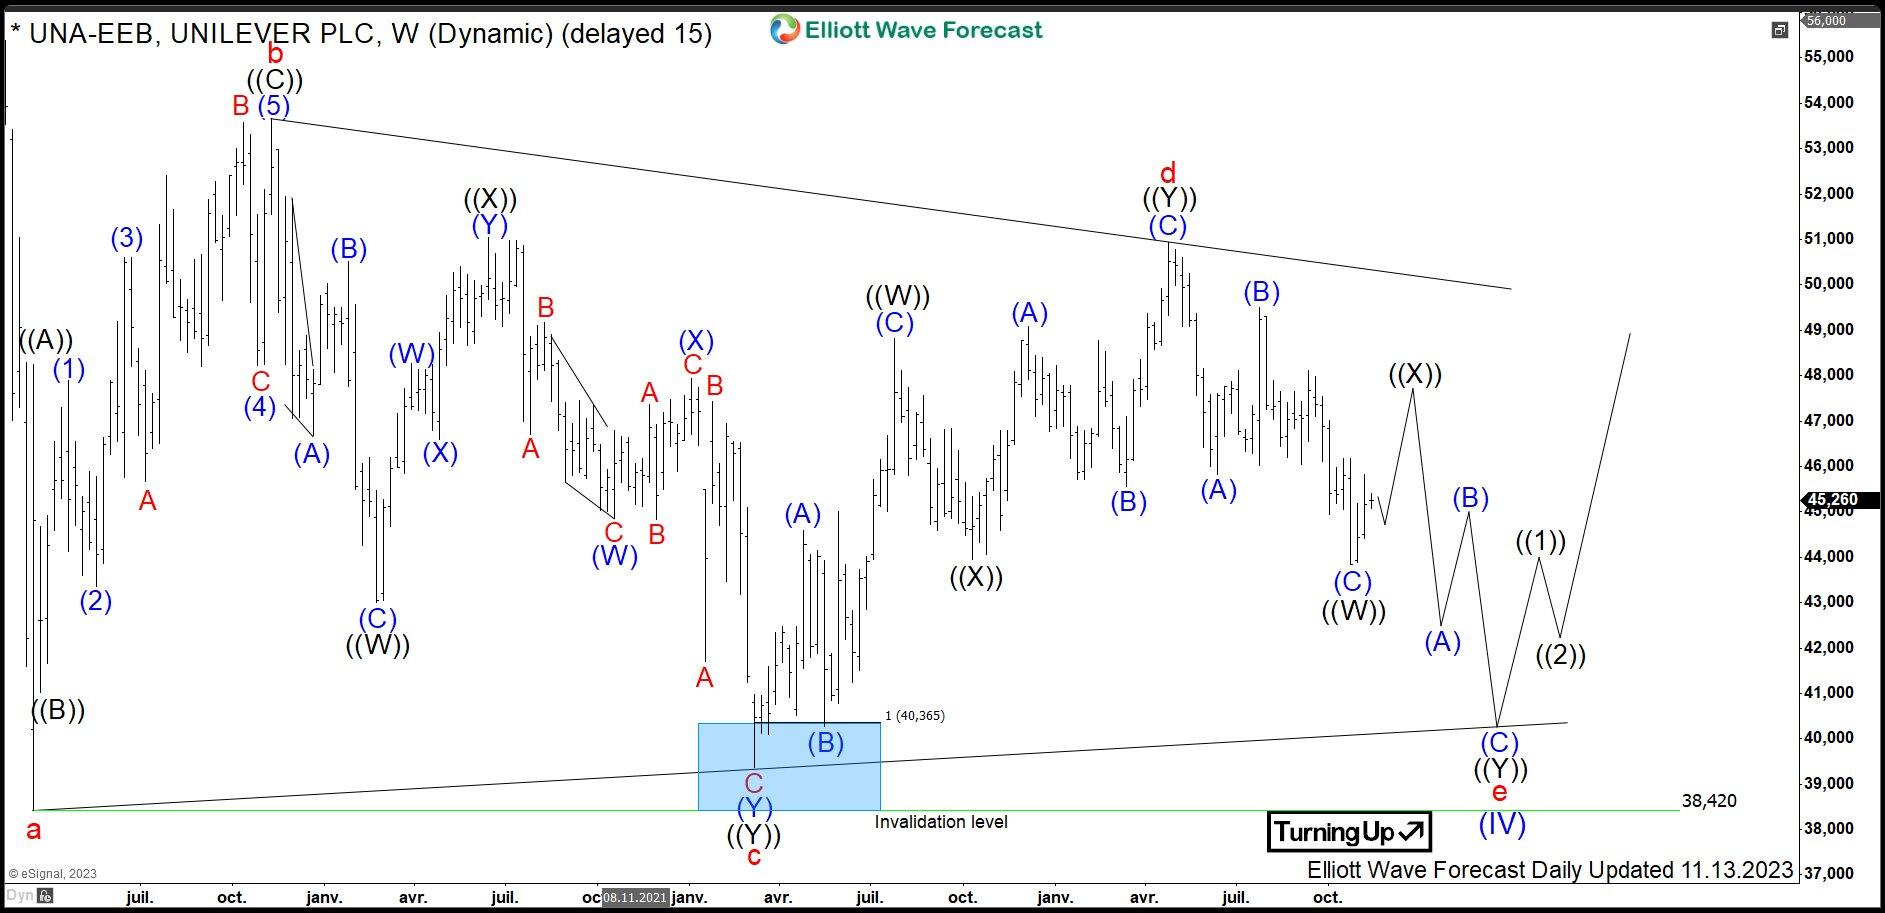
Unilever weekly Elliott Wave analysis 11.14.2023

The weekly chart below shows the $UNA shares price action in more detail. In particular, it demonstrates the converging price action within a blullish triangle. Firstly, 3 swings lower of red wave a have ended on March 2020 at 38.42 lows. Secondly, a bounce in 3 swings of red wave b have set a lower high in December 2020 at 53.66. Thirdly, 7 swings (= 3 swings) of red wave c have printed a higher low in March 2022 at 39.36. Fourthly, 7 swings of red wave d have accomplished in April 2023 at 50.93 lower peak. Finally, red wave e is unfolding in another 7 swings and should find support above 39.36 lows. Then, blue wave (IV) should end and a rally towards new all-time highs should take place.

Investors and traders can be looking to buy $UNA in 7 swings against 39.36 lows targeting 62.33-69.72 area and even higher in the medium-term.

Share: Feed news

FURTHER DISCLOSURES AND DISCLAIMER CONCERNING RISK, RESPONSIBILITY AND LIABILITY Trading in the Foreign Exchange market is a challenging opportunity where above average returns are available for educated and experienced investors who are willing to take above average risk. However, before deciding to participate in Foreign Exchange (FX) trading, you should carefully consider your investment objectives, level of xperience and risk appetite. Do not invest or trade capital you cannot afford to lose. EME PROCESSING AND CONSULTING, LLC, THEIR REPRESENTATIVES, AND ANYONE WORKING FOR OR WITHIN WWW.ELLIOTTWAVE- FORECAST.COM is not responsible for any loss from any form of distributed advice, signal, analysis, or content. Again, we fully DISCLOSE to the Subscriber base that the Service as a whole, the individual Parties, Representatives, or owners shall not be liable to any and all Subscribers for any losses or damages as a result of any action taken by the Subscriber from any trade idea or signal posted on the website(s) distributed through any form of social-media, email, the website, and/or any other electronic, written, verbal, or future form of communication . All analysis, trading signals, trading recommendations, all charts, communicated interpretations of the wave counts, and all content from any media form produced by www.Elliottwave-forecast.com and/or the Representatives are solely the opinions and best efforts of the respective author(s). In general Forex instruments are highly leveraged, and traders can lose some or all of their initial margin funds. All content provided by www.Elliottwave-forecast.com is expressed in good faith and is intended to help Subscribers succeed in the marketplace, but it is never guaranteed. There is no “holy grail” to trading or forecasting the market and we are wrong sometimes like everyone else. Please understand and accept the risk involved when making any trading and/or investment decision. UNDERSTAND that all the content we provide is protected through copyright of EME PROCESSING AND CONSULTING, LLC. It is illegal to disseminate in any form of communication any part or all of our proprietary information without specific authorization. UNDERSTAND that you also agree to not allow persons that are not PAID SUBSCRIBERS to view any of the content not released publicly. IF YOU ARE FOUND TO BE IN VIOLATION OF THESE RESTRICTIONS you or your firm (as the Subscriber) will be charged fully with no discount for one year subscription to our Premium Plus Plan at $1,799.88 for EACH person or firm who received any of our content illegally through the respected intermediary’s (Subscriber in violation of terms) channel(s) of communication.

Recommended content


Recommended content

Editors’ Picks

EUR/USD stays in positive territory above 1.0850 after US data

EUR/USD stays in positive territory above 1.0850 after US data

EUR/USD clings to modest daily gains above 1.0850 in the second half of the day on Friday. The improving risk mood makes it difficult for the US Dollar to hold its ground after PCE inflation data, helping the pair edge higher ahead of the weekend.

EUR/USD News

GBP/USD stabilizes above 1.2850 as risk mood improves

GBP/USD stabilizes above 1.2850 as risk mood improves

GBP/USD maintains recovery momentum and fluctuates above 1.2850 in the American session on Friday. The positive shift seen in risk mood doesn't allow the US Dollar to preserve its strength and supports the pair.

GBP/USD News

Gold rebounds above $2,380 as US yields stretch lower

Gold rebounds above $2,380 as US yields stretch lower

Following a quiet European session, Gold gathers bullish momentum and trades decisively higher on the day above $2,380. The benchmark 10-year US Treasury bond yield loses more than 1% on the day after US PCE inflation data, fuelling XAU/USD's upside.

Gold News

Avalanche price sets for a rally following retest of key support level

Avalanche price sets for a rally following retest of  key support level

Avalanche (AVAX) price bounced off the $26.34 support level to trade at $27.95 as of Friday. Growing on-chain development activity indicates a potential bullish move in the coming days.

Read more

The election, Trump's Dollar policy, and the future of the Yen

The election, Trump's Dollar policy, and the future of the Yen

After an assassination attempt on former President Donald Trump and drop out of President Biden, Kamala Harris has been endorsed as the Democratic candidate to compete against Trump in the upcoming November US presidential election.

Read more

Forex MAJORS

Cryptocurrencies

Signatures