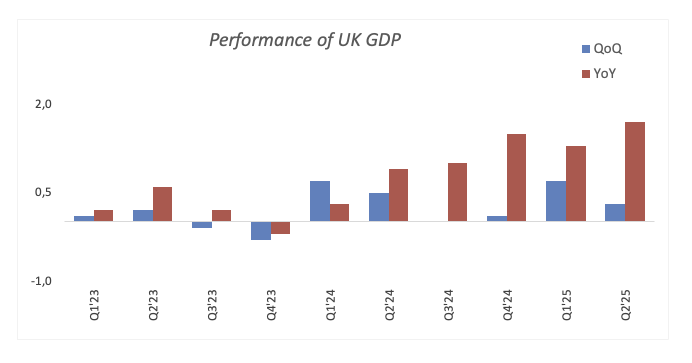
UK Preliminary GDP rises 0.1% QoQ in Q3 2025 vs. 0.2% forecast

The UK economy expanded at a quarterly rate of 0.1% in the three months to September 2025, following a 0.3% growth in the second quarter (Q2).
The data missed the market forecast of 0.2% in the reported period.
The UK GDP rose 1.3% year-over-year (YoY) in Q3 2025 vs. 1.4% expected and a 1.4% growth in Q2.
The monthly UK GDP arrived at -0.1% in September, compared to 0% in August (revised from a 0.1% expansion), weaker than the estimated 0% print.
Other data from the UK showed that Industrial Production and Manufacturing Production declined 2% and 1.7%, respectively, over the month in September. Both readings missed market expectations.
Market reaction to the UK data
The Pound Sterling attracts some sellers in an immediate reaction to the UK GDP data. At the press time, the GBP/USD pair is down 0.21% on the day to trade at 1.3104.
(This story was corrected on November 13 at 7:42 GMT to say that the UK GDP rose 1.3% YoY in Q3 2025, not Q2, and the monthly GDP arrived at -0.1% in September, compared to 0% in August, not May.)
Pound Sterling Price Last 7 Days
The table below shows the percentage change of British Pound (GBP) against listed major currencies last 7 days. British Pound was the weakest against the Swiss Franc.
| USD | EUR | GBP | JPY | CAD | AUD | NZD | CHF | |
|---|---|---|---|---|---|---|---|---|
| USD | -0.84% | -0.42% | 0.54% | -0.68% | -0.85% | 0.25% | -1.42% | |
| EUR | 0.84% | 0.42% | 1.38% | 0.16% | -0.01% | 1.10% | -0.58% | |
| GBP | 0.42% | -0.42% | 0.95% | -0.26% | -0.43% | 0.68% | -1.00% | |
| JPY | -0.54% | -1.38% | -0.95% | -1.22% | -1.37% | -0.31% | -1.94% | |
| CAD | 0.68% | -0.16% | 0.26% | 1.22% | -0.16% | 0.93% | -0.74% | |
| AUD | 0.85% | 0.01% | 0.43% | 1.37% | 0.16% | 1.11% | -0.59% | |
| NZD | -0.25% | -1.10% | -0.68% | 0.31% | -0.93% | -1.11% | -1.67% | |
| CHF | 1.42% | 0.58% | 1.00% | 1.94% | 0.74% | 0.59% | 1.67% |
The heat map shows percentage changes of major currencies against each other. The base currency is picked from the left column, while the quote currency is picked from the top row. For example, if you pick the British Pound from the left column and move along the horizontal line to the US Dollar, the percentage change displayed in the box will represent GBP (base)/USD (quote).
This section below was published at 16:55 GMT on Wednesday as a preview of the UK GDP data
- The UK GDP is forecast to post a decent expansion in Q3.
- The BoE expects the economy to expand by 1.5% in 2025.
- GBP/USD seems to have met firm resistance near 1.3200.
The UK’s Office for National Statistics (ONS) will release the advanced prints of the Q3 Gross Domestic Product (GDP) on Thursday. If the figures meet market consensus, the UK economy would have maintained its pace of expansion at 1.4% annualised, showing that momentum could have begun to stall. The QoQ report is expected to show a mild GDP growth of 0.2%.
At the Bank of England's (BoE) latest gathering, the Monetary Policy Committee (MPC) anticipated the domestic economy to grow by 1.5% in the current year.
According to projections, the BoE could further lower its policy rate by an additional 25 basis points at its December 18 gathering, particularly following a cooling labour market and a loss of momentum in domestic inflation.
Projections for the UK GDP
The Office for National Statistics (ONS) reported that the UK economy expanded 0.3% QoQ in the second quarter, compared with the 0.7% gain posted in the January-March period. On a monthly basis, the UK GDP expanded by a meagre 0.1% in September and is expected to remain flat in October.
In its latest meeting, the BoE downgraded its forecast for economic growth and now expects GDP to expand by 0.2% in Q3 (from “around 0.4%” in September).
Regarding inflation, the UK's Consumer Price Index (CPI) continues to rank among the highest within its major peers. As indicated by the most recent ONS report, in September, the headline CPI rose by 3.8% YoY, while the core print gained 3.5% YoY and 4.7% from services inflation.
When will the UK release Q3 GDP, and how could it affect GBP/USD?
The UK will release the preliminary Q3 Gross Domestic Product (GDP) on Thursday at 7:00 GMT.
Pablo Piovano, Senior Analyst at FXStreet, says, “GBP/USD’s current recovery appears to have met some decent hurdle around the 1.3200 region.”
“If bulls push harder, Cable could challenge its critical 200-day SMA in the 1.3270 region, prior to provisional barriers at its 55-day and 100-day SMA at 1.3382 and 1.3420, respectively. Further up comes the October top at 1.3527 (October 1), prior to the September ceiling at 1.3726 (September 17),” Piovano adds.
“On the flip side, the loss of the November base at 1.3010 (November 5) could see the next significant contention not before the April floor at 1.2707 (April 7),” he concludes.
GDP FAQs
A country’s Gross Domestic Product (GDP) measures the rate of growth of its economy over a given period of time, usually a quarter. The most reliable figures are those that compare GDP to the previous quarter e.g Q2 of 2023 vs Q1 of 2023, or to the same period in the previous year, e.g Q2 of 2023 vs Q2 of 2022. Annualized quarterly GDP figures extrapolate the growth rate of the quarter as if it were constant for the rest of the year. These can be misleading, however, if temporary shocks impact growth in one quarter but are unlikely to last all year – such as happened in the first quarter of 2020 at the outbreak of the covid pandemic, when growth plummeted.
A higher GDP result is generally positive for a nation’s currency as it reflects a growing economy, which is more likely to produce goods and services that can be exported, as well as attracting higher foreign investment. By the same token, when GDP falls it is usually negative for the currency. When an economy grows people tend to spend more, which leads to inflation. The country’s central bank then has to put up interest rates to combat the inflation with the side effect of attracting more capital inflows from global investors, thus helping the local currency appreciate.
When an economy grows and GDP is rising, people tend to spend more which leads to inflation. The country’s central bank then has to put up interest rates to combat the inflation. Higher interest rates are negative for Gold because they increase the opportunity-cost of holding Gold versus placing the money in a cash deposit account. Therefore, a higher GDP growth rate is usually a bearish factor for Gold price.
Author
FXStreet Team
FXStreet
Composed of a group of economic journalists and FX experts, the FXStreet content team produces and oversees all content published on FXStreet. It provides a purely journalistic approach to the Forex market.


