TMUS gains 35% off the bluebox, Buyers regain control

TMUS resumes the long term bullish sequence after finding the low for the March 2025 pullback in the blue box on 17th June 2025. The upside is now largely favored, going into the new trading week. What should traders expect next?
T-Mobile US (NASDAQ: TMUS) is a leading U.S. wireless carrier, known for its aggressive pricing and nationwide 5G network. Headquartered in Bellevue, Washington, it is majority-owned by Deutsche Telekom. Since merging with Sprint in 2020, T-Mobile has become the third-largest U.S. telecom provider. It is listed on the NASDAQ-100 and S&P 500 indices.
TMUS has been in a clear bullish sequence since 17th January 2022 when it finished wave IV of the cycle degree as we noted in the 24th May 2025 updates From the low of 17th January 2022, price rallied to complete wave ((1)) to ((4)) of V. Wave ((4)) corrective pullback ended on 1st June 2025. A strong impulse cycle followed and break above the wave ((3)) high to establish wave (1) of ((5)). Afterwards, the wave (2) of ((5)) followed from the 3rd of March 2025 where the stock price peaked. In a bullish sequence, we like to buy at the extreme of 3/7/11 swing pullback. Thus, we prepared for dip to end at the blue box of 7-swing pullback on the 24th May 2025 update. We shared the chart below.
TMUS Elliott Wave analysis – 24th May 2025 update
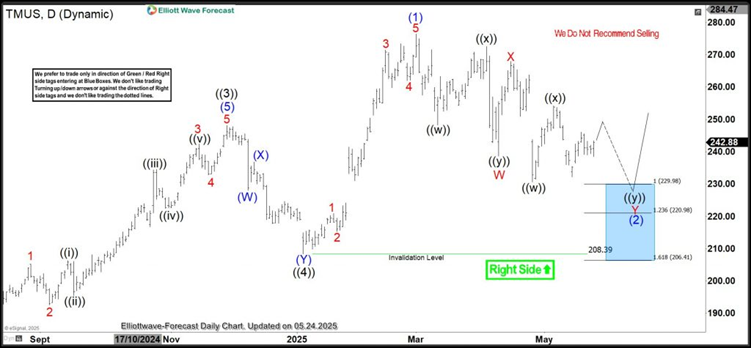
TMUS, Daily Chart
TMUS Elliott Wave Analysis – 28th June update
On the 28th June, the stock reached the extreme area marked with the blue box. Thus, buyers entered into new trades to take advantage of an expected rally. The chart below shows what we used in the follow-up update on 28th June 2025.
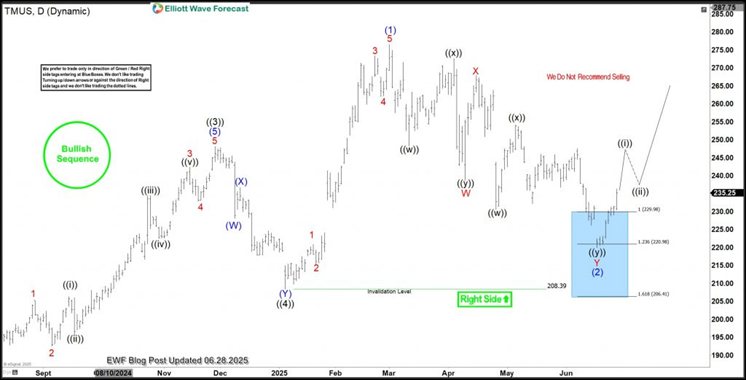
TMUS Daily
TMUS Elliott Wave analysis – 17th August update
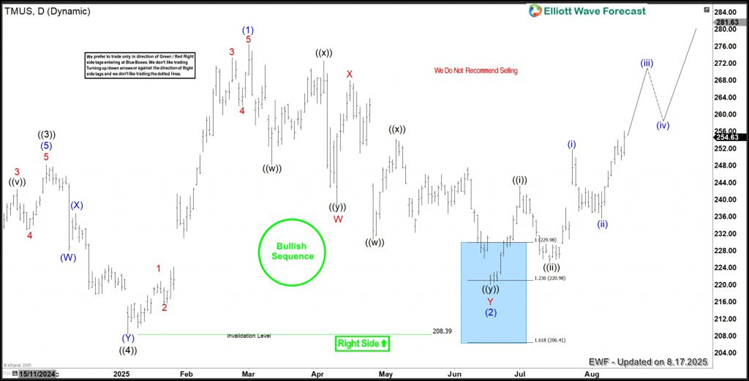
The chart above shows the TMUS latest daily. The stock is currently pushing away from the blue box up to 35% already. Buyers should hold on to the Long up to $304 and even $331 in the medium term. This is a perfect blue box Elliottwave-Forecast setup that we like sharing with members on 78 instruments covering H1, H4, Daily and Weekly charts across ETFs, Stocks, Forex, Commodities, Indices and Cryptos.
Author

Elliott Wave Forecast Team
ElliottWave-Forecast.com


