|

The upsloping parallel channel that may finally cause the SMH to pull back

The semiconductor ETF, SMH, continues its relentless climb, setting new all-time highs yet again yesterday. Powered by the strength of leading semiconductor names like AMD and NVDA, the ETF has seen an incredible run — up over 100% from its Liberation Day lows in April. 

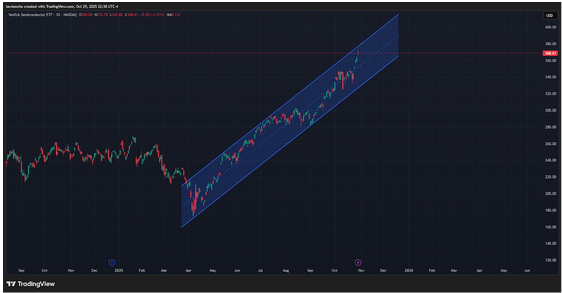
As a trader, when I look at the technicals, what immediately stands out to me is the clear upsloping parallel channel that has defined this move. While the momentum remains strong, it’s often at these extremes where patience and precision matter most.

For context, the SMH (VanEck Semiconductor ETF) is designed to track the performance of the MVIS US Listed Semiconductor 25 Index. It holds some of the largest and most influential semiconductor companies in the world — names like NVIDIA, Taiwan Semiconductor, Broadcom, and Intel. Because of its concentration in high-growth chipmakers, SMH has become one of the best indicators of overall sentiment in the semiconductor space. When SMH rallies, it usually means strength across the board in tech and innovation-driven sectors.

Looking closely at the technicals, I have an upsloping parallel channel on the chart drawn across the recent price action, and I view it as a potential warning sign. The top of that parallel currently sits near the $380 area, which aligns with a potential short-term resistance zone. If SMH pushes into that level, I’d expect a pullback or at least a period of consolidation before any further move higher. 

For traders, there are two potential plays here: shorting the ETF near the top of the channel or waiting for confirmation by entering on a break below the lower bound of that same channel.

No matter which approach is taken, proper risk management remains key. This type of setup can provide a great opportunity, but without clear stops and defined risk parameters, even a solid technical thesis can turn into a painful lesson. As always, discipline and patience matter most when trading setups like this.

fxsoriginal

Author

Lawton Ho

Lawton Ho

Verified Investing

A marketing expert sharing his journey to mastering the charts.

More from Lawton Ho
Share:

Editor's Picks

EUR/USD tests nine-day EMA support near 1.1850

EUR/USD inches lower during the Asian hours on Monday, trading around 1.1870 at the time of writing. The 14-day Relative Strength Index momentum indicator at 56 stays above the midline, confirming improving momentum. RSI has cooled from prior overbought readings but stabilizes above 50, suggesting dips could stay limited before buyers reassert control.

GBP/USD flat lines as traders await key UK macro data and FOMC minutes

The GBP/USD pair kicks off a new week on a subdued note and oscillates in a narrow range, just below mid-1.3600s, during the Asian session. Moreover, the mixed fundamental backdrop warrants some caution for aggressive traders as the market focus now shifts to this week's important releases from the UK and the US.

Gold slides below $5,000 amid USD uptick and positive risk tone; downside seems limited

Gold attracts fresh sellers at the start of a new week and reverses a part of Friday's strong move up of over $150 from sub-$4,900 levels. The commodity slides back below the $5,000 psychological mark during the Asian session, though the downside potential seems limited amid a combination of supporting factors.

Bitcoin, Ethereum and Ripple consolidate within key ranges as selling pressure eases

Bitcoin and Ethereum prices have been trading sideways within key ranges following the massive correction. Meanwhile, XRP recovers slightly, breaking above the key resistance zone. The top three cryptocurrencies hint at a potential short-term recovery, with momentum indicators showing fading bearish signs.

Global inflation watch: Signs of cooling services inflation

Realized inflation landed close to expectations in January, as negative base effects weighed on the annual rates. Remaining sticky inflation is largely explained by services, while tariff-driven goods inflation remains limited even in the US.

Ripple Price Forecast: XRP potential bottom could be in sight

Ripple edges up above the intraday low of $1.35 at the time of writing on Friday amid mixed price actions across the crypto market. The remittance token failed to hold support at $1.40 the previous day, reflecting risk-off sentiment amid a decline in retail and institutional sentiment.