The travelers TRV is looking for more upside to end an impulse

The Travelers Companies, Inc., TRV, is an American insurance company. It is the second-largest writer of U.S. commercial property casualty insurance, and the sixth-largest writer of U.S. personal insurance through independent agents.
Weekly TRV chart July 2024
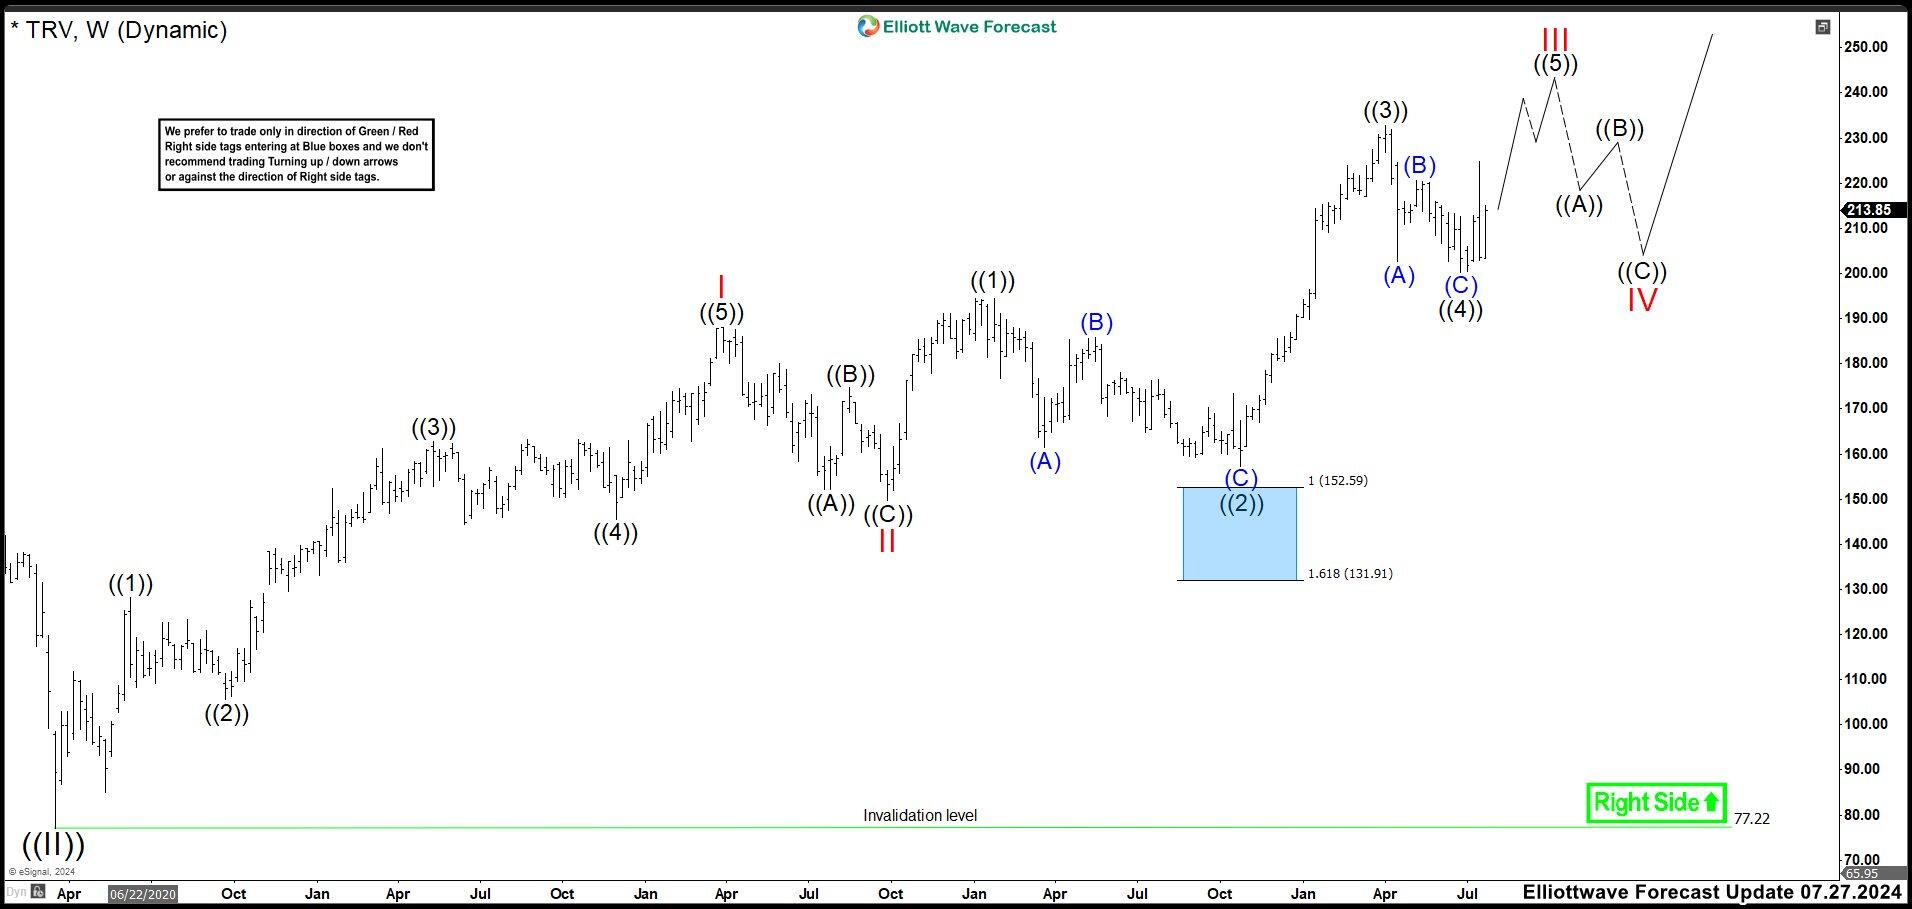
In July, we saw a rally as expected, but missing the blue box by 5 dollars. Also, we adjusted the count in TRV weekly chart. We are still trading in wave ((III)), but with the new data, the stock is still in wave (I) of ((III)). Therefore, wave I higher ended at 187.98 and pullback as wave II finished at 149.65 low. The price rallied again breaking wave I high suggesting that wave III of (I) had started. Then, wave ((1)) of III ended at 194.51 and the correction that we are expecting to enter the market ended at 157.33 low as wave ((2)). From here, we can see a strong momentum to the upside ending wave ((3)) of III at 232.75 high. Wave ((4)) of III built a zigzag correction ended at 200.21 low.
We were looking one more push to the upside to complete wave ((5)) of III and wave III of (I) before starting a retracement in wave IV of (I). The possible area to end wave ((5)) was in 240.74 – 253.27 where we are expecting a reaction lower to think that the cycle was ended. (If you want to learn more about flat corrections, please follow these links: Elliott Wave Education and Elliott Wave Theory).
Weekly TRV chart December 2024
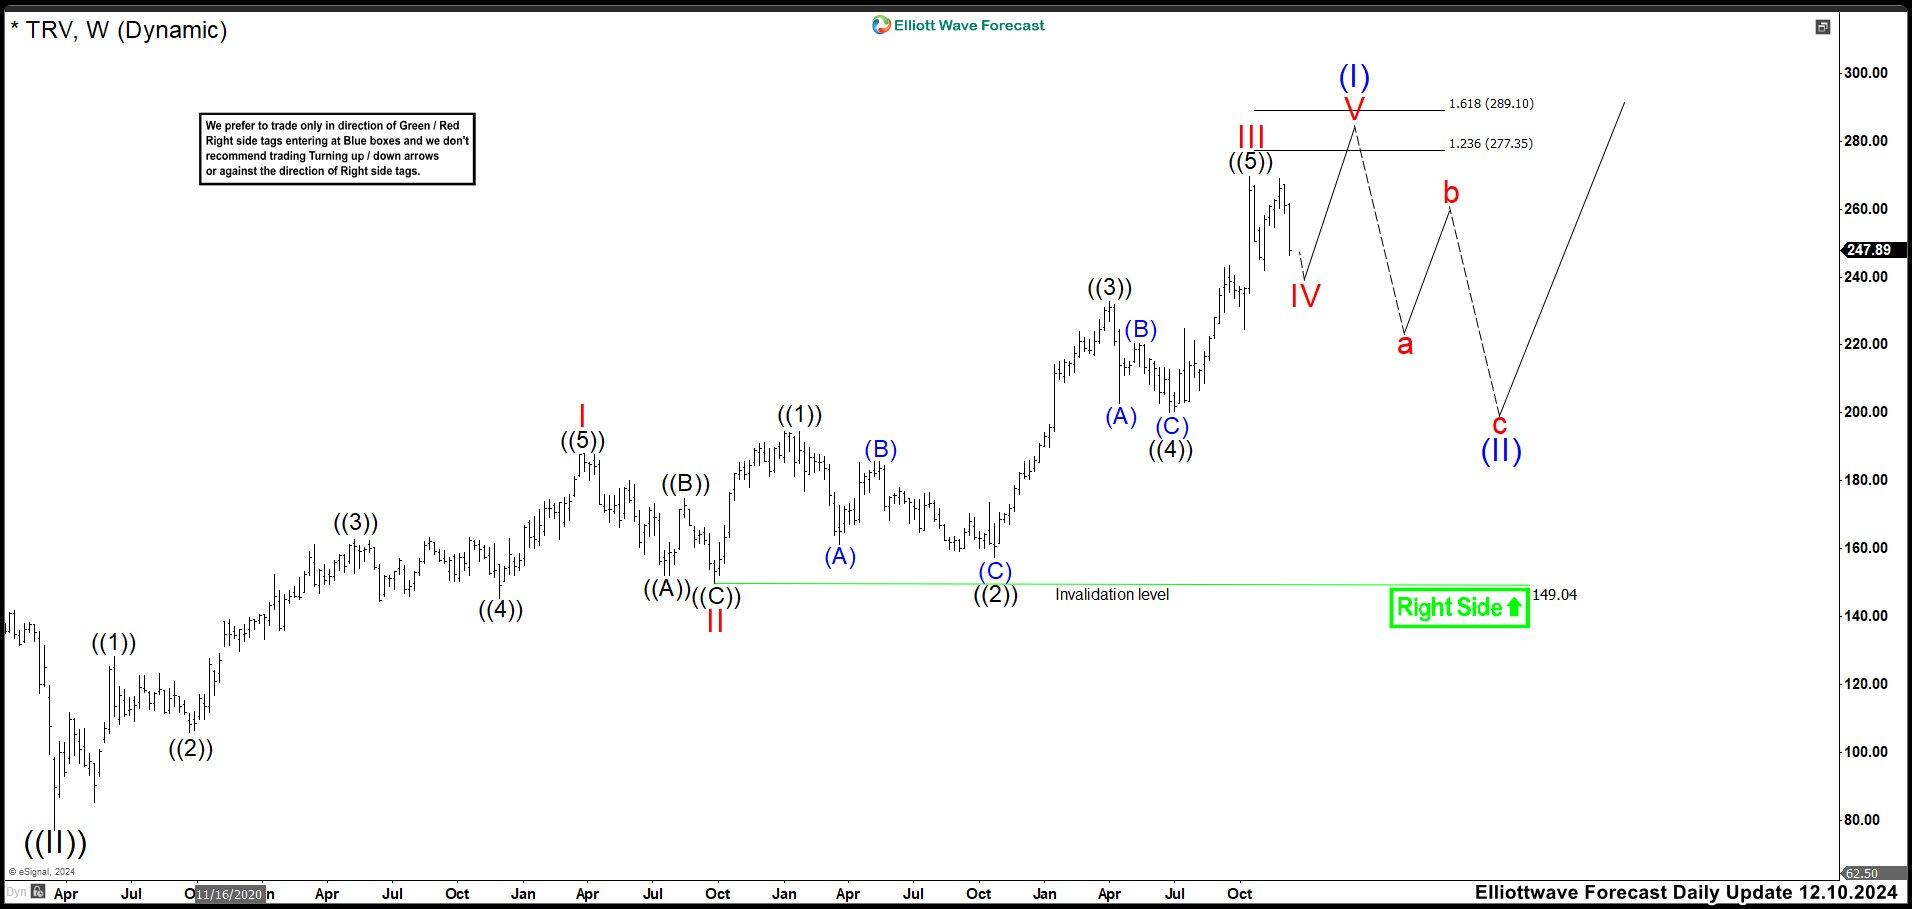
In December chart, we can see the market rallied reaching 269.56 high, above of the expected area in 240.74 – 253.27. Here, TRV reacted downwards giving the idea that wave IV had already started. Therefore, we called the 269.56 high as wave III. We expect to continue lower to complete wave IV in the form of a flat structure. This could end up in the 241.57 – 234.99 area, and then see one more rally on wave V. If the next rally is not extended, the wave V should end in 277.35 – 289.10 area, but we cannot rule out a bullish extension. After reaching the 277.35 – 289.10 area, the market should break below wave IV to confirm that wave V and wave (I) are over to avoid extensions, and that we have entered in the retracement of wave (II).
Author

Elliott Wave Forecast Team
ElliottWave-Forecast.com


