The monthly Nasdaq 100 chart is concerning

We don’t want to make anyone panic, but a good argument can be made for aggressively protecting tech stock holdings. If my memory serves me correctly, we haven’t shared this monthly chart since late 2021 (when it was featured on the December 21st, 2021, episode of Mad Money). At the time, we were concerned about the unhealthy, steeply sloped rally. Since then, the NASDAQ 100 corrected from just under 17,000 to just over 10,000, later rallying back to make new all-time highs. However, those new highs are raising some red flags.
Despite the deep correction, the gains are still wildly outsized relative to historical bull market trajectories. The dotted black line represents a natural market slope on the provided monthly NASDAQ 100 futures market chart. It is easy to see that despite the digestion from late 2021 through the fall of 2023, the rally is still statistically ahead of schedule.
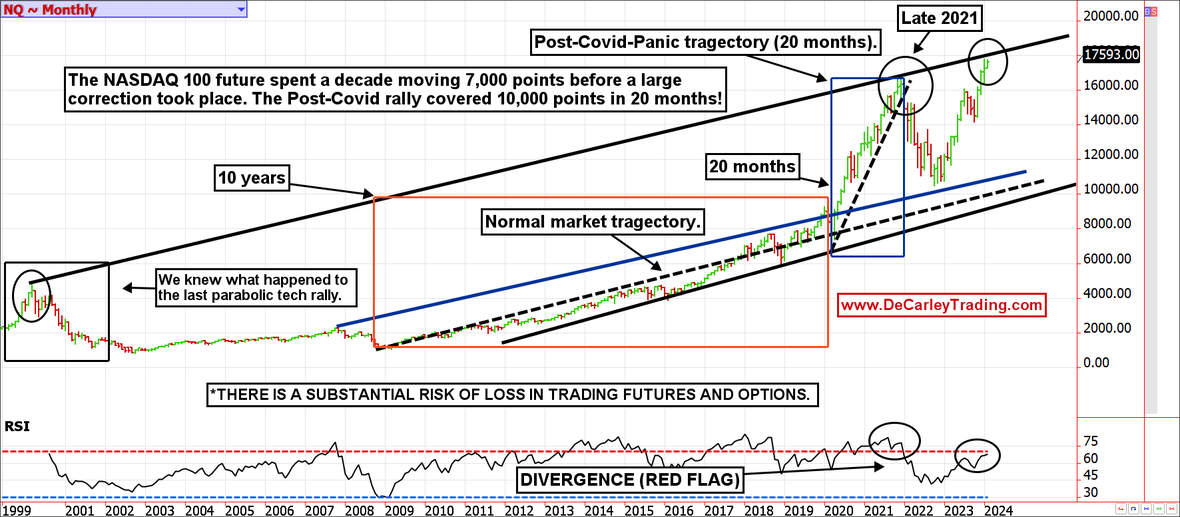
Also concerning is the divergence in the RSI (Relative Strength Index). In 2021, near the peak, the RSI on a monthly chart was reading 78.00. Today, with the NASDAQ 100 at a higher price, the RSI is still under 70.00. This type of disconnect between price and oscillator is often a red flag for trend exhaustion.
Lastly, we noticed that drawing a trendline from the dot.com bubble high through the 2021 high creates a trendline that could act as swift resistance at just under 18,000 (not far from recent highs). Is this trendline arbitrary? Maybe, but in my experience, simple lines drawn on a chart work far more often than they should.
If we wanted to believe the chart full stop, we could make an argument that the NASDAQ 100 could correct to under 12,000. We aren’t ready to “buy” into that theory just yet. Election years are generally good for markets, and the January barometer suggests 2024 is statistically set to be a positive one overall. Nevertheless, a correction seems imminent.
Author

Carley Garner
DeCarley Trading
Carley Garner is an experienced commodity broker with DeCarley Trading, a division of Zaner, in Las Vegas, Nevada. She is also the author of multiple books including, “Higher Probability Commodity Trading” and “A Trader's First Book on Commodities”.


