The Coca-Cola Company (KO) Elliott Wave technical analysis [Video]
![The Coca-Cola Company (KO) Elliott Wave technical analysis [Video]](https://editorial.fxstreet.com/images/TechnicalAnalysis/ChartPatterns/Candlesticks/close-up-of-candlestick-stock-chart-with-pen-40815814_XtraLarge.jpg)
KO Elliott Wave analysis
Mode: Impulsive.
Structure: Motive.
Position: Wave 5.
Direction: Top in wave 5.
Details: Looking for a clear five-wave move into Intermediate wave (1) to be either completed or near completion as we have reached the medium level at $65.
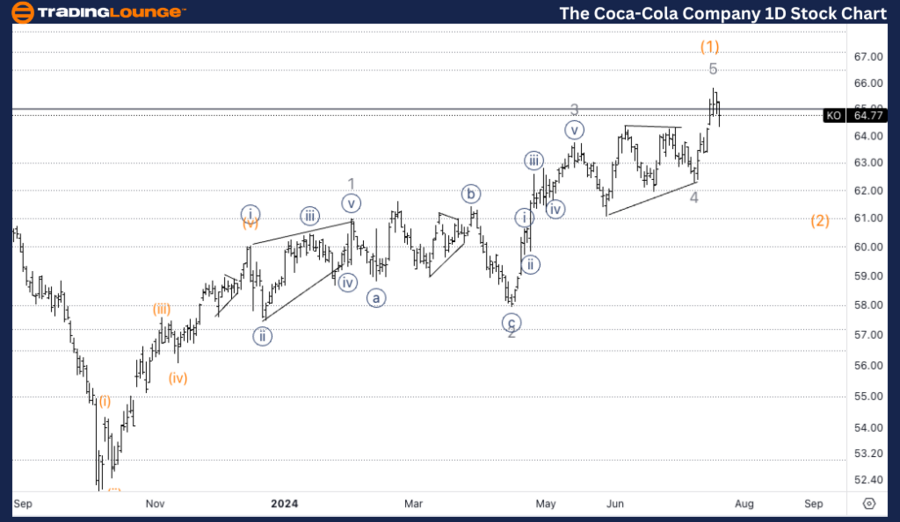
KO Elliott Wave technical analysis – Daily chart
The daily chart indicates a clear five-wave move into Intermediate wave (1), which is either completed or near completion as the price has reached the medium level around $65. Traders should watch for signs of a potential top in wave 5, as this could indicate the end of the current bullish phase and the beginning of a corrective phase.
KO Elliott Wave technical analysis
Mode: Impulsive.
Structure: Motive.
Position: Wave 5.
Direction: Top in wave 5.
Details: Looking for either a top in wave 5 as we can count a five-wave move from the bottom in the triangle in wave 4, or else we just completed wave {i} of 5.
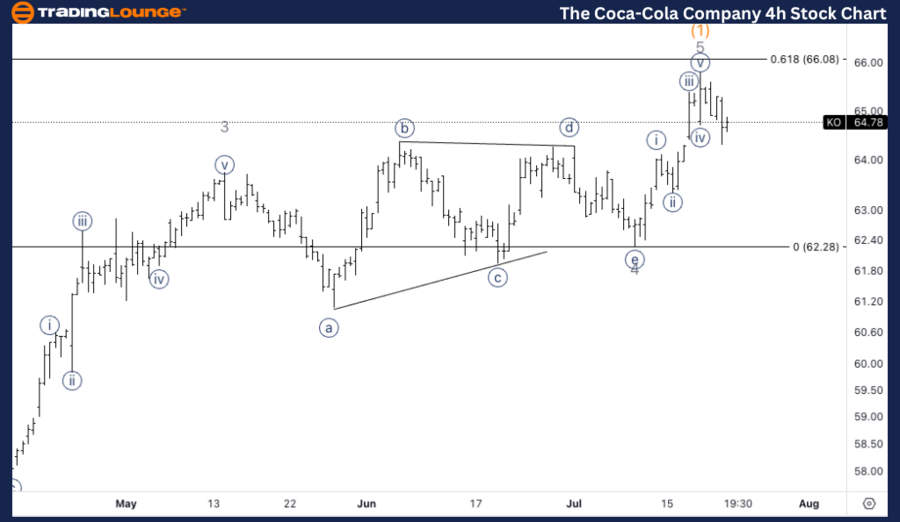
KO Elliott Wave technical analysis – Four-hour chart
The 4-hour chart shows that a five-wave move can be counted from the bottom of the triangle in wave 4, suggesting that wave 5 might be completed or wave {i} of 5 is completed. This indicates that traders should be cautious of a potential top formation and be prepared for a possible corrective move.
Welcome to our latest Elliott Wave analysis for The Coca-Cola Company (KO) as of July 23, 2024. This analysis provides an in-depth look at KO's price movements using the Elliott Wave Theory, helping traders identify potential opportunities based on current trends and market structure. We will cover insights from both the daily and 4-hour charts to offer a comprehensive perspective on KO's market behavior.
The Coca-Cola Company (KO) Elliott Wave technical analysis [Video]
Author

Peter Mathers
TradingLounge
Peter Mathers started actively trading in 1982. He began his career at Hoei and Shoin, a Japanese futures trading company.


