The Boeing Company (BA) Elliott Wave technical analysis [Video]
![The Boeing Company (BA) Elliott Wave technical analysis [Video]](https://editorial.fxsstatic.com/images/i/Equity-Index_IBEX-1_XtraLarge.jpg)
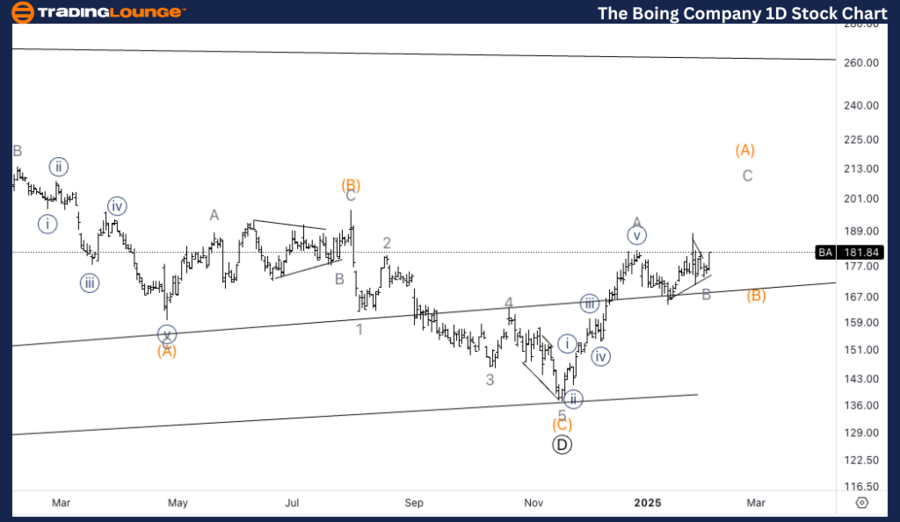
BA Elliott Wave technical analysis
Function: Counter Trend
Mode: Corrective
Structure: Triangle
Position: Wave (A) of E
Direction: Upside in wave C of (A).
Details: We are looking for upside into wave C of (A), which could also turn out to be wave (C) of E instead, hence one degree higher. Looking for upside potentially towards Trading Level 2 t 200$ as upside target.
BA Elliott Wave technical analysis – Daily chart
The Boeing Company (BA) appears to be in a corrective triangle pattern, currently unfolding in wave (A) of E. We expect upside momentum into wave C of (A), with a potential alternative scenario suggesting that this could be wave (C) of E, one degree higher. The key upside target lies near the TradingLevel2 at $200. Traders should watch for further strength as the stock approaches this target, as it could signal either the completion of wave (A) or indicate a more extended upward correction.
BA Elliott Wave technical analysis
Function: Counter Trend
Mode: Corrective
Structure: Triangle
Position: Wave B of (A).
Direction: Upside in wave C.
Details: Looking for upside into wave C as we seem to have completed the triangle in wave B. Increasing volume on the bottom of B seems to be suggesting the low is in place. Looking for 200$ as minimum upside target.
BA Elliott Wave technical analysis – One-hour chart
On the 1-hour chart, BA seems to have completed a triangle formation in wave B of (A), with the current wave C expected to push higher. Increasing volume at the bottom of wave B suggests that a low may already be in place. A continued breakout and rise toward the $200 target could confirm the completion of wave C, with further upside momentum likely. Monitoring key levels and volume will be important to confirm this corrective wave pattern.
.png.9bb525c8686a76ccb0a368a1669e0a70.png)
This Elliott Wave analysis of The Boeing Company, (BA) outlines both the daily and 1-hour chart structures, highlighting the current trends and possible future price movements.
The Boeing Company (BA) Elliott Wave technical analysis [Video]
Author

Peter Mathers
TradingLounge
Peter Mathers started actively trading in 1982. He began his career at Hoei and Shoin, a Japanese futures trading company.


