Tesla (TSLA) Stock Price and Forecast: Tesla slows into first gear as key resistance level nears
- Tesla shares steady on Friday, a small fall of 1% but still at key juncture.
- TSLA shares have fallen sharply since January.
- TSLA rallies up to resistance at the 200-day moving average.

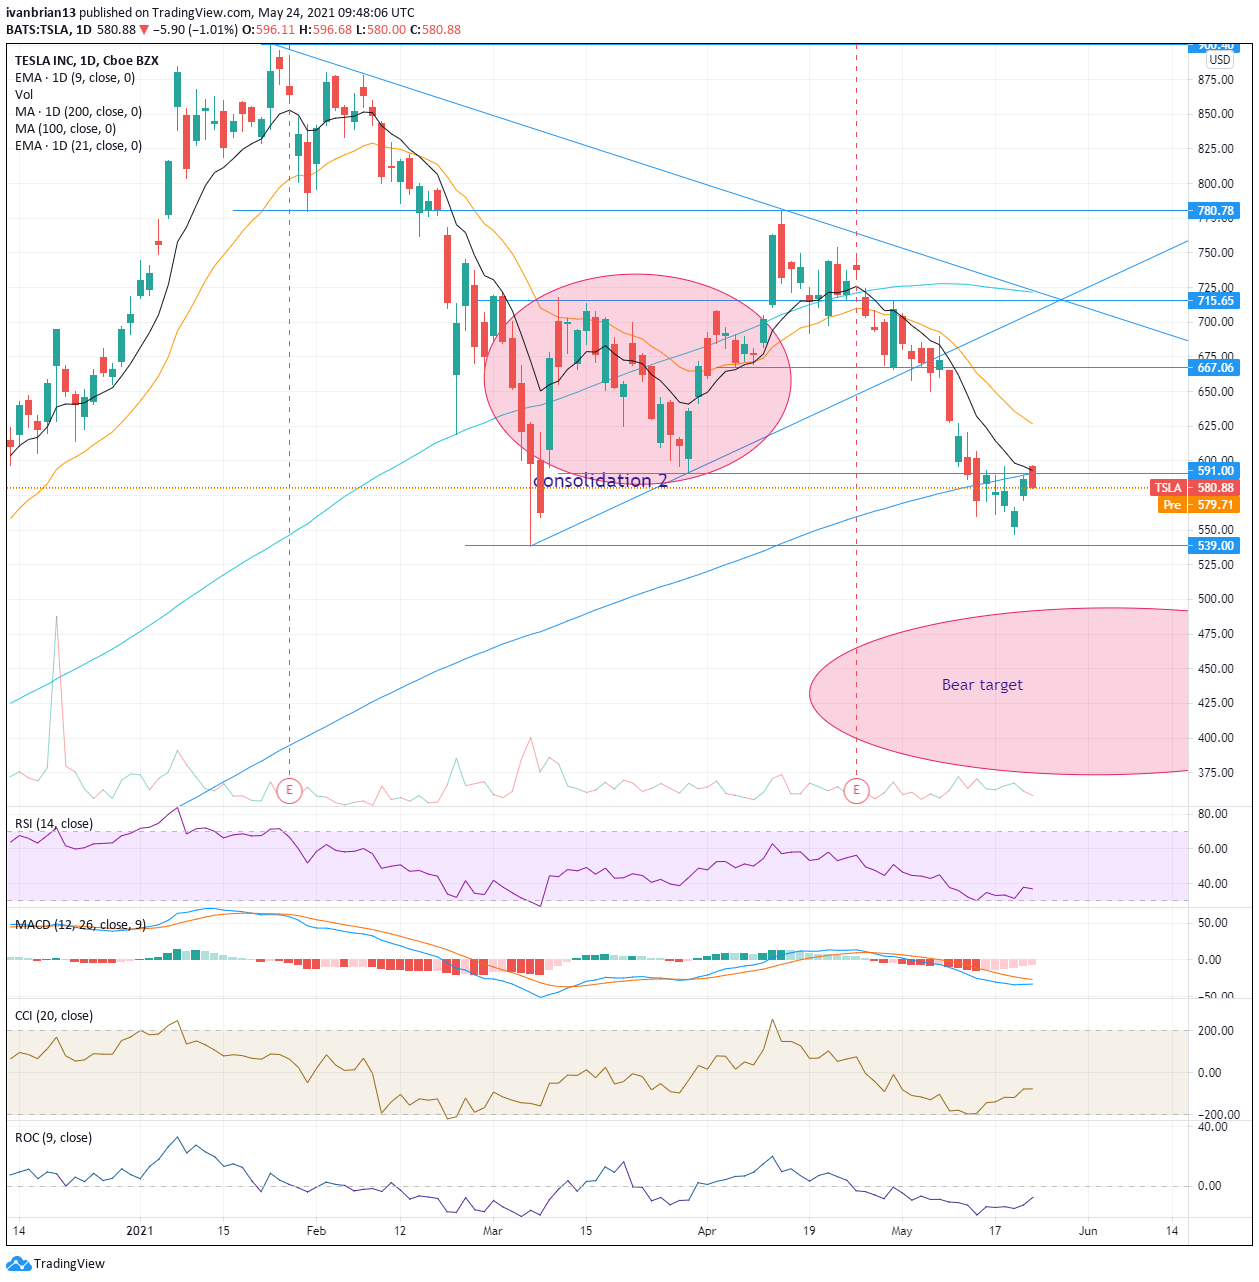
Tesla shares lost some ground on Friday, but it was a relatively modest 1% loss with the shares closing at $580.88. Earlier in the week, Tesla shares had dropped to $546 as continued negative momentum built around the stock. However, the momentum indicators signaled the move was oversold and Tesla shares duly recovered. Both Relative Strength Index (RSI) and Commodity Channel Index (CCI) had dropped into oversold territory on May 13.
Tesla now has rallied up to its key 200-day moving average at $591. This is also where the 9-day moving average sits, so it is a key short and long-term resistance level. A confluence of indicators or resistance levels makes them stronger and thus harder to break through. Weekend reports circulated on social media that Tesla is now sitting on a loss for its Bitcoin investment that is bigger than the profit reported by Tesla for Q1 2021. This will likely hurt the share price again, but so far Tesla is holding steady in the early premarket session.
Tesla stock forecast
Tesla has been in a classic downtrend since late January with a series of lower highs and lows. The break of $780 in late February was what really ended any hope of bulls returning as that key support was broken, then retested and failed. While Thursday's bounce was encouraging, there is still work to do.
A beautiful 4% move from Tesla on Thursday saw it retrace up to the 200-day moving average at $590. This is now the key level, and it has a confluence of resistance with the $591 line, identified and the short-term 9-day moving average. As mentioned this will be a tough resistance to break given all three resistance factors at play.
Any break above $591 could accelerate to $625 as there is not much volume despite the steep fall – a form of vacuum. The earlier failure to break $539 can also be taken as a small victory for bulls on the longer-term horizon, as it will result in a higher low, albeit only marginally. Clearly, $539 is now the key to the recovery seen late last week in Tesla shares. $591 may prove too much resistance too soon, but holding $539 is needed to stabilize recent losses and consolidate for another swipe at the $591 level. Breaking this $539 level probably sees Tesla slip further to the bear target in the $440 region. Hold and Tesla can stabilize. Any break above $625 sees bulls back in control. The momentum oscillators RSI, CCI and ROC have all been close to or signaling oversold conditions recently.
| Support | 539 | 500 | 465 | 430 | ||
| Resistance | 591 | 625 | 667 | 715 | 781 |
At the time of writing, the author has no position in any stock mentioned in this article and no business relationship with any company mentioned. The author has not received compensation for writing this article, other than from FXStreet.
This article is for information purposes only. The author and FXStreet are not registered investment advisors and nothing in this article is intended to be investment advice. It is important to perform your own research before making any investment and take independent advice from a registered investment advisor.
FXStreet and the author do not provide personalized recommendations. The author makes no representations as to accuracy, completeness, or the suitability of this information. FXStreet and the author will not be liable for any errors, omissions or any losses, injuries or damages arising from this information and its display or use. The author will not be held responsible for information that is found at the end of links posted on this page.
Errors and omissions excepted.
Author

Ivan Brian
FXStreet
Ivan Brian started his career with AIB Bank in corporate finance and then worked for seven years at Baxter. He started as a macro analyst before becoming Head of Research and then CFO.


