Tesla (TSLA) Stock Price and Forecast: Is this ever going to break higher?
- Tesla stock continues to steadily push higher.
- The electric car stock moving slowly, unlike the car which recently set a record at Nurburgring.
- TSLA targets $780 resistance first as volume thins out.

Tesla put in another solid and steady performance on Wednesday with the stock nudging higher by just over 1.5% to close at $755.83. This marks some continued nice recovery for the stock, which suffered a fairly steep fall on Monday at the open, attributed to possible options related trading ahead of quadruple witching on Friday. Quadruple witching (see more) is the expiry of single stock futures, single stock options, index options, and index futures.
Tesla, as it is a member of the S&P 500, is going to be pulled in all directions from the various market makers ahead of quadruple witching, so some unusual moves may not actually be that unusual this week and volume is likely to be high into the close on Friday.
-637673824272501152.png)
Tesla 15-minute chart
Tesla opened and tested lower on Wednesday before buyers stepped into all indices and Tesla also and the stock rallied steadily through the day.
Tesla key statistics
| Market Cap | $728 billion |
| Price/Earnings | 394 |
| Price/Sales | 23 |
| Price/Book | 29 |
| Enterprise Value | $756 billion |
| Gross Margin | 22% |
| Net Margin |
6% |
| 52-week high | $900.40 |
| 52-week low | $329.88 |
| Average Wall Street Rating and Price Target | Hold, $704 |
Tesla stock forecast
The damage from that spike lower on Tuesday to $708 has now been forgotten, with the chart looking a bit more bullish. Happy is the trader that got some cheap stock on that spike. Now Tesla has moved back above the key $750 level, where volume starts to get lighter making gains easier to achieve. We want the stock to get pretty quickly above $760, as volume really drops off there and it also takes out the highs from last week. Once through there, we would be thinking a move to $780 should work quickly in our view.
FXStreet view: TSLA remaining bullish above $740. Neutral from $740 to $700, bearish below $700 but not strongly so until below $620.
FXStreet trading ideas: Buy dip zones at $740, $691 – the 200-day moving average– and $680 as volume is high here. Please use stops.
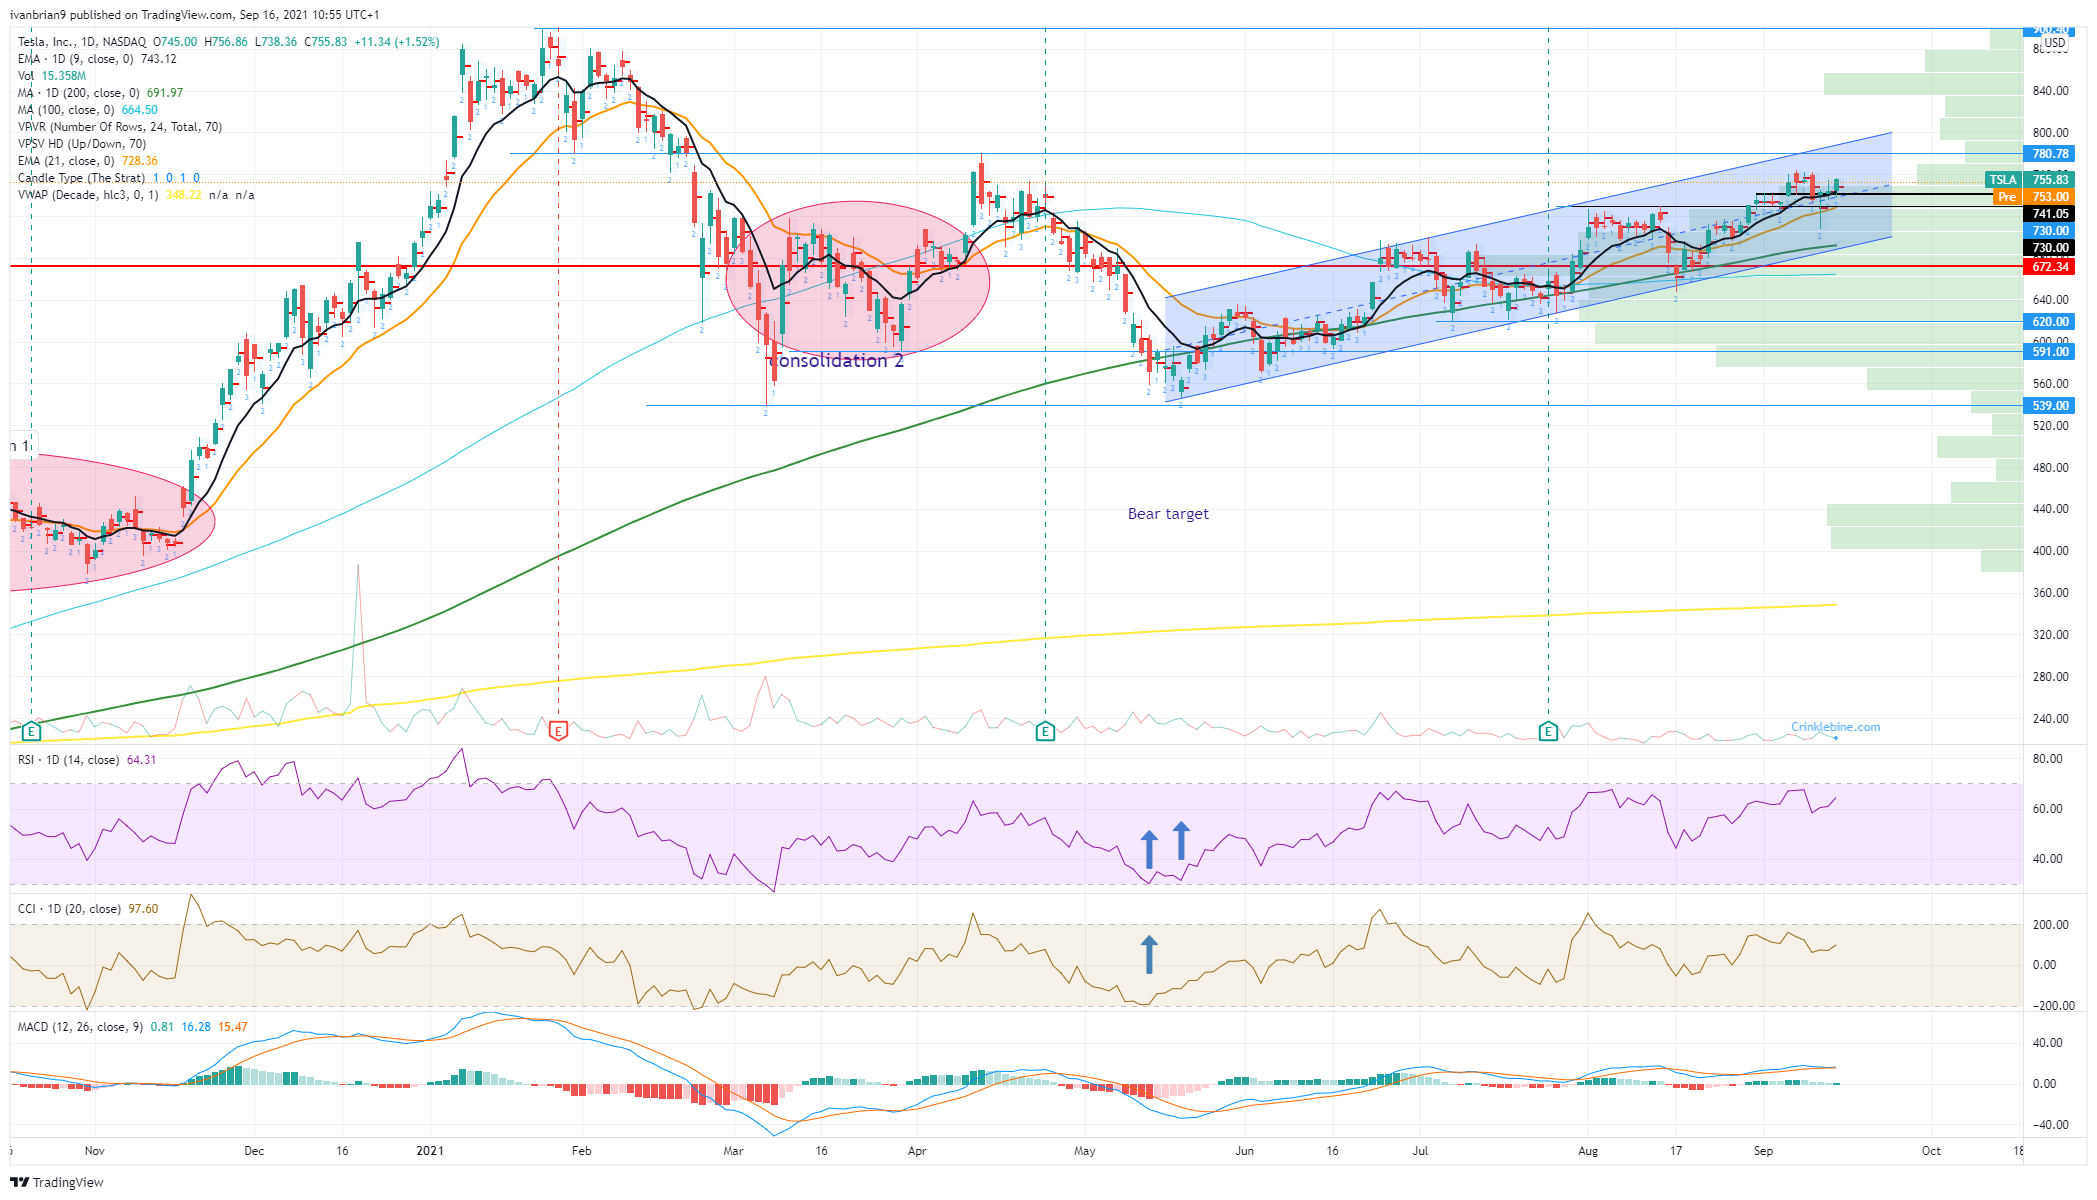
TSLA daily chart
Premium
You have reached your limit of 3 free articles for this month.
Start your subscription and get access to all our original articles.
Author

Ivan Brian
FXStreet
Ivan Brian started his career with AIB Bank in corporate finance and then worked for seven years at Baxter. He started as a macro analyst before becoming Head of Research and then CFO.


