Tesla Stock Price (TSLA): Tesla shares heading lower, 200 day moving average at $579
- Tesla shares suffer again on Wednesday, drop 4%.
- TSLA broke triangle support, support zone sub $500.
- TSLA shares have support at $579 and $539 on the way lower.

Update May 13: Tesla continues to trade in textbook fashion from a triangle break lower. Next up is the 200-day moving average at $579 and then the low from March 5 at $539. If these are broken, Tesla shares chould head below $500 to the consolidation zone from September and October of last year.
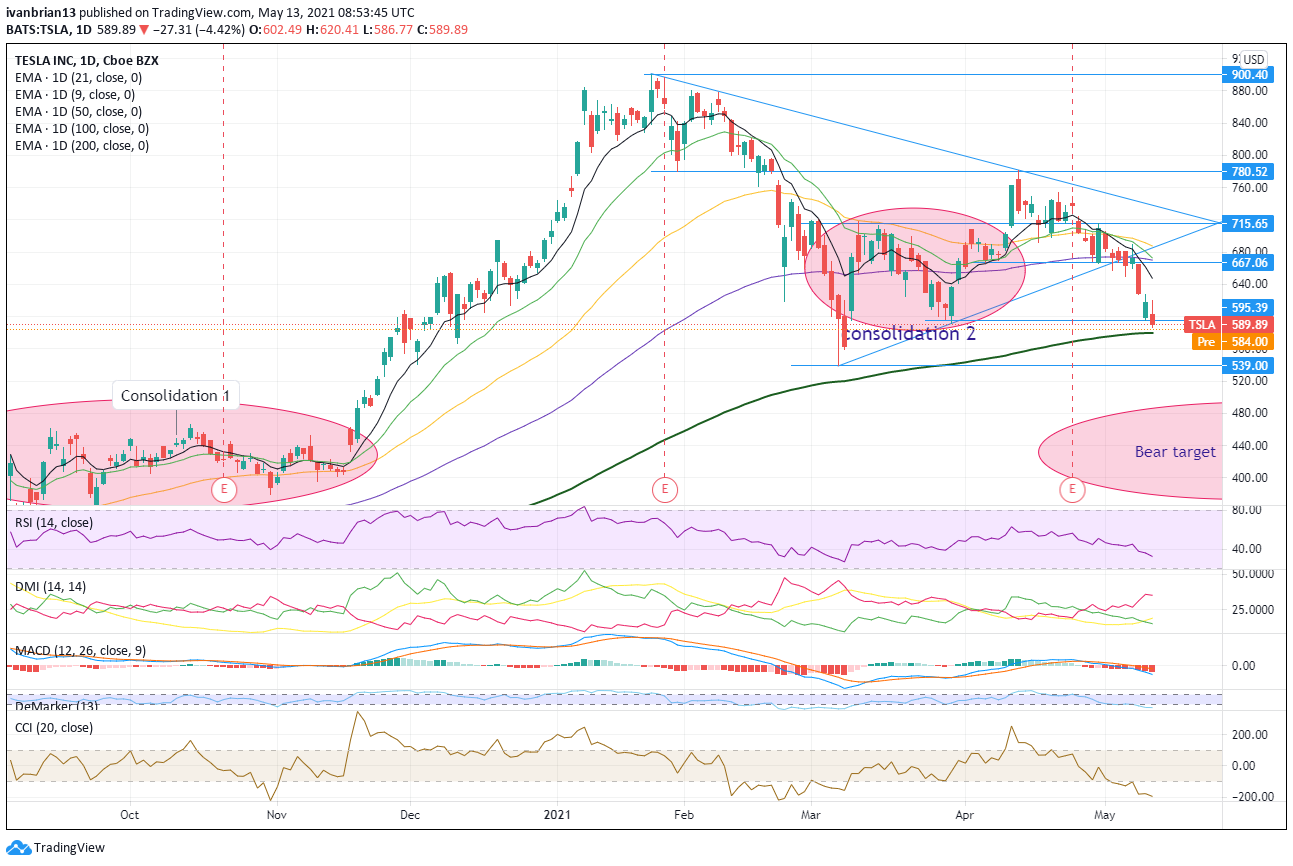
Update: Tesla shares continue to suffer on Tuesday as risk-off hurts equities as investors turn cautious ahead of Friday's employment report. Tesla is dangerously close to breaking the lower end of its triangle support. A break would be bearish with a sub $500 as next support.
Tesla shares have just not been right since reporting earnings on April 26. Earnings per share (EPS) did beat analyst expectations, but the manner of the beat and revenue did not sit well with investors. Basically, Tesla made a lot of money from Bitcoin trading and from environmental credits – not from selling vehicles.
Stay up to speed with hot stocks' news!
Tesla is one of the most well-known and followed stocks and garners significant attention from both retail and institutional investors. Elon Musk is rarely out of the news, and Tesla has revolutionized the adoption of electric vehicle technology. However, investors are now wondering if Tesla has poked the bear, so to speak, and may end up being a victim of its own success. All legacy carmakers have announced plans to commit to a fully electric future. The majority of legacy auto manufacturers have targeted 2030 for this transition.
Tesla stock forecast
Tesla is more volatile than the broader stock market, i.e. it has a higher beta. It has been suffering volatile falls given its rapid appreciation last year.
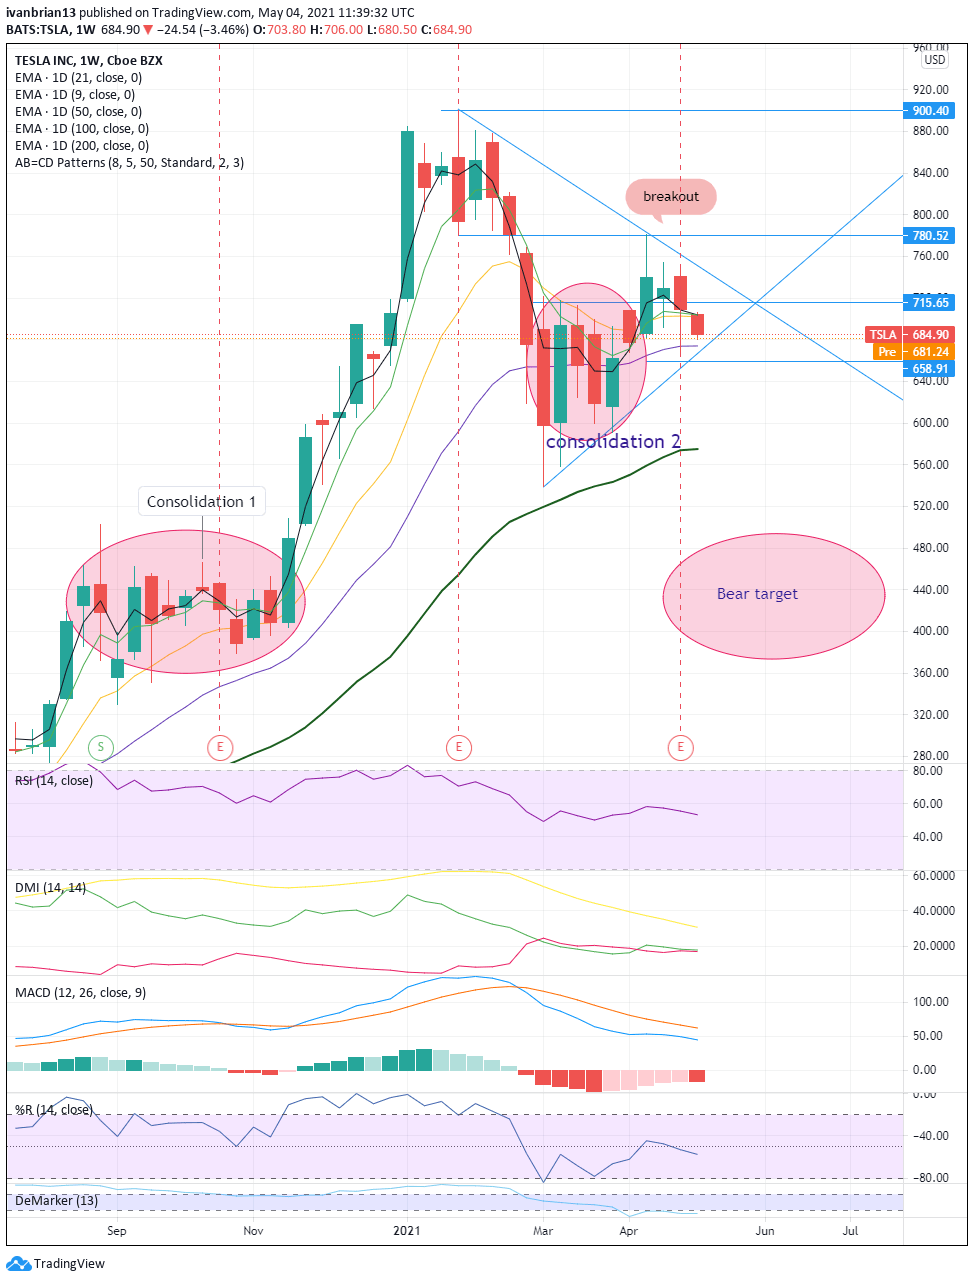
The longer-term chart clearly shows where Tesla has come from, as well as the strong first phase of price consolidation and the sudden and sharp pace of the breakout. This is what breakouts are supposed to look like, sharp and sudden. Now Tesla has returned to the price range of its second consolidation. The bear target could be a return to the original consolidation area below $500. $780 is a big resistance level, and failure to breach has resulted in a bearish move.
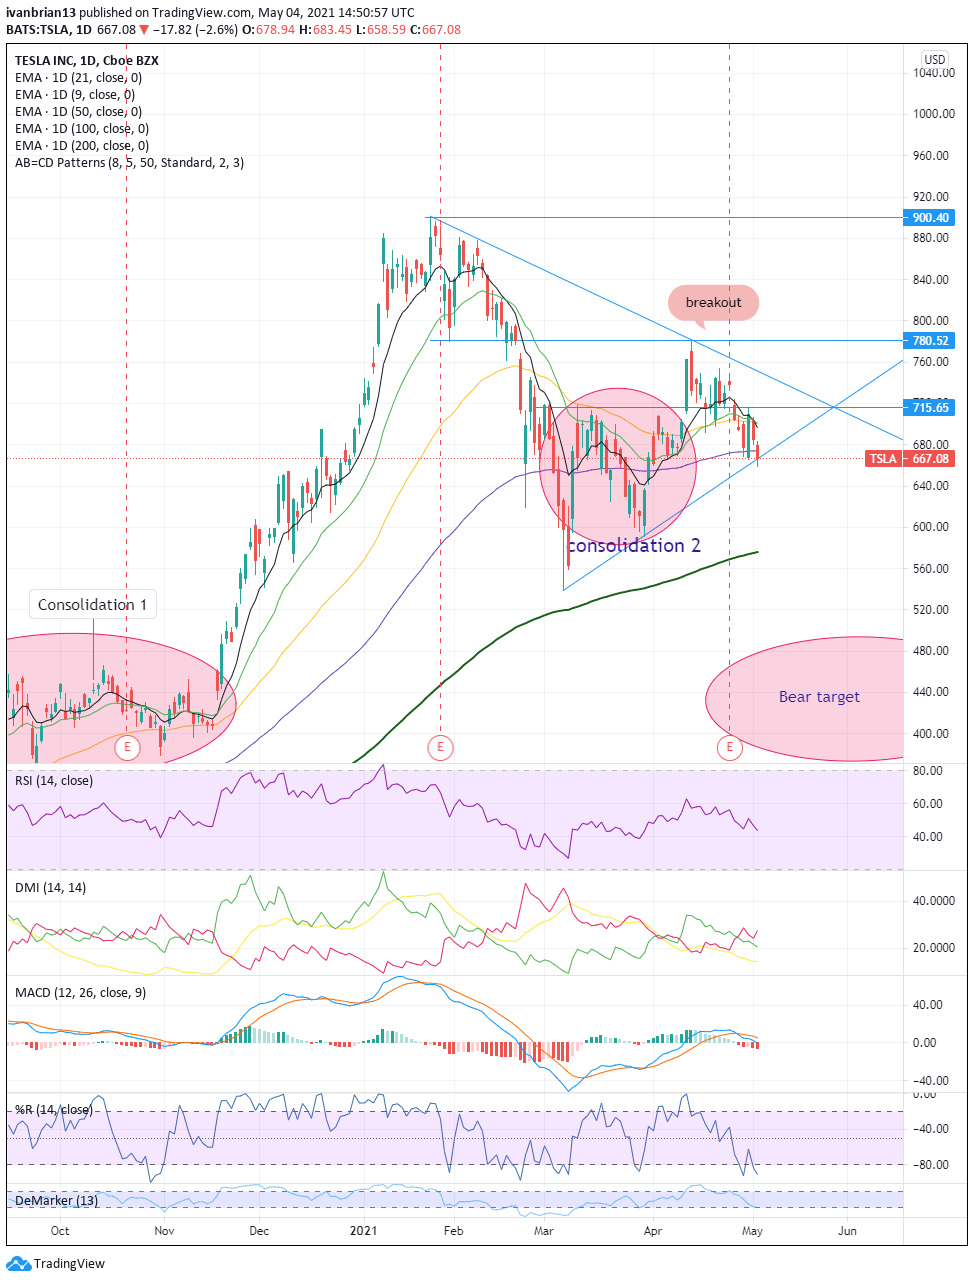
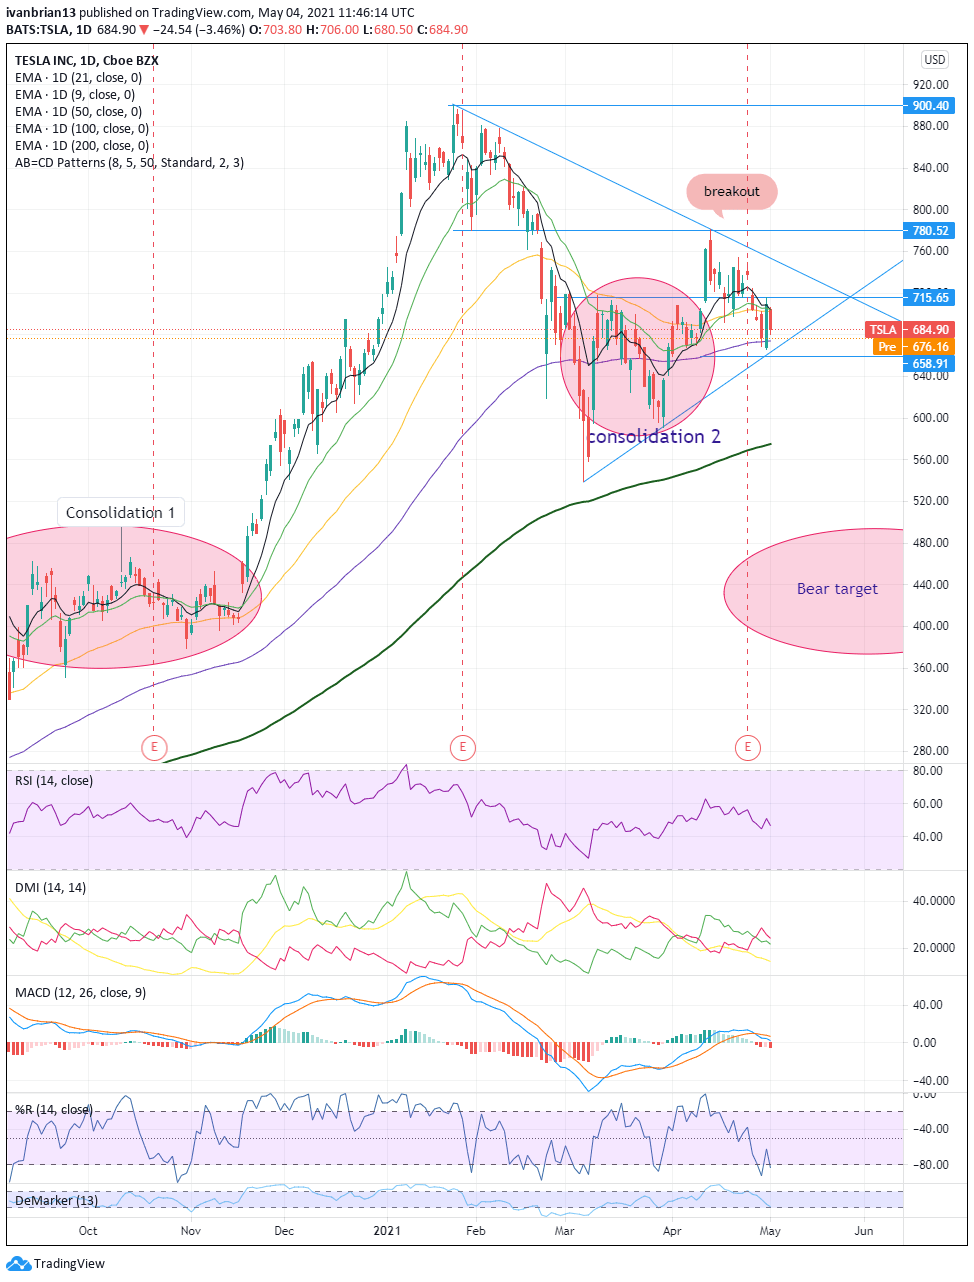
The daily chart shows us the problem for Tesla bulls. The 9-day moving average is holding Tesla in place, and this is now converging into a strong resistance area as the 9, 21 and 50-day moving averages converge around $702. This will prove tough to break. Should TSLA break above here, it will be a strong bullish move with a target of $750, the top of the triangle formation and an ultimate test of new highs.
Failure to push higher will see Tesla shares target the lower end of the triangle at $667 and a breakout of the triangle could give bears the ultimate aim of a return to the first consolidation area. Support along the way comes in at $674 from the 100-day moving average and $575 from the 200-day moving average.
Moving Average Convergence Divergence (MACD) has crossed into a negative signal as has the Directional Movement Index (DMI) but with a weak signal.
| Support | Resistance |
| 674 | 702 |
| 663 | 704 |
| 591 | 716 |
| 575 | 750 |
| 539 | 780 |
| 900 |
At the time of writing, the author has no position in any stock mentioned in this article and no business relationship with any company mentioned. The author has not received compensation for writing this article, other than from FXStreet.
This article is for information purposes only. The author and FXStreet are not registered investment advisors and nothing in this article is intended to be investment advice. It is important to perform your own research before making any investment and take independent advice from a registered investment advisor.
FXStreet and the author do not provide personalized recommendations. The author makes no representations as to accuracy, completeness, or the suitability of this information. FXStreet and the author will not be liable for any errors, omissions or any losses, injuries or damages arising from this information and its display or use. The author will not be held responsible for information that is found at the end of links posted on this page.
Errors and omissions excepted.
Premium
You have reached your limit of 3 free articles for this month.
Start your subscription and get access to all our original articles.
Author

Ivan Brian
FXStreet
Ivan Brian started his career with AIB Bank in corporate finance and then worked for seven years at Baxter. He started as a macro analyst before becoming Head of Research and then CFO.


